Written by Lauren Clubb, Roberto Ogelman & Pranita Atri
Key Takeaways
- Seed funding varies significantly across global ecosystems: Established hubs such as San Francisco, Boston, and Shanghai show a higher prevalence of large seed rounds, while emerging ecosystems tend to raise smaller early rounds. These patterns suggest that seed size reflects the maturity and capital availability of a given ecosystem.
- Seed round size does not reflect the magnitude of series A growth: Companies that raise larger seed rounds generally raise larger series A rounds. However, the increase between seed and Series A funding is often smaller when the seed round is large, indicating that early capital may restrict the relative growth between financing stages.
- Initial capital does not reliably predict long-term success: While early capital can accelerate development, scientific validity, execution, and market alignment ultimately determine long-term outcomes.
Introduction
A common assumption in biotech and healthcare is that the size of a company’s initial seed round sets the foundation for future outcomes and lifecycle. Large seed rounds are taken as validation of scientific rigor, team strength, and long-term potential, while smaller initial funding can be viewed as a signal of fragility or limited ambition. This assumption is reinforced by headlines celebrating large launches and the prominent idea that capital intensity equates with success.
In this article we examine how initial seed funding across different global ecosystems affects subsequent funding rounds, highlighting some case studies to dive into how early stage capital signals eventual success or failure. Each ecosystem is subject to its own strengths and weaknesses, and the efficacy of early stage capital deployment is in part determined by that context. Here, we aim to illuminate the variability of the relationship between initial capital and future success based on the idiosyncrasies of each ecosystem.
To compare the impact of early stage capital investment in a range of global ecosystems we compare the average seed and series A funding rounds for biotech companies founded from 2015-2025. We test the hypothesis that the size of a company’s seed round is a unique indicator for successfully raising additional rounds of capital. Through case studies we investigate whether larger initial funding provides a longer runway, enabling companies to weather initial challenges, complete critical proof-of-concept studies, and de-risk their technologies sufficiently to attract subsequent, larger rounds of investment.
Ecosystems exhibit unique early financing patterns
To begin analyzing the variability of seed and series A funding rounds across ecosystems we first pulled financing data from Crunchbase for companies founded in 2015, to allow for sufficient time (~10 years) to raise capital and achieve some output of success or failure.
Overall, we find that distinct ecosystems have unique norms for early financing, indicating that seed round size is not just an indicator of team and tech strength, but also a function of local investor trends and infrastructure maturity.
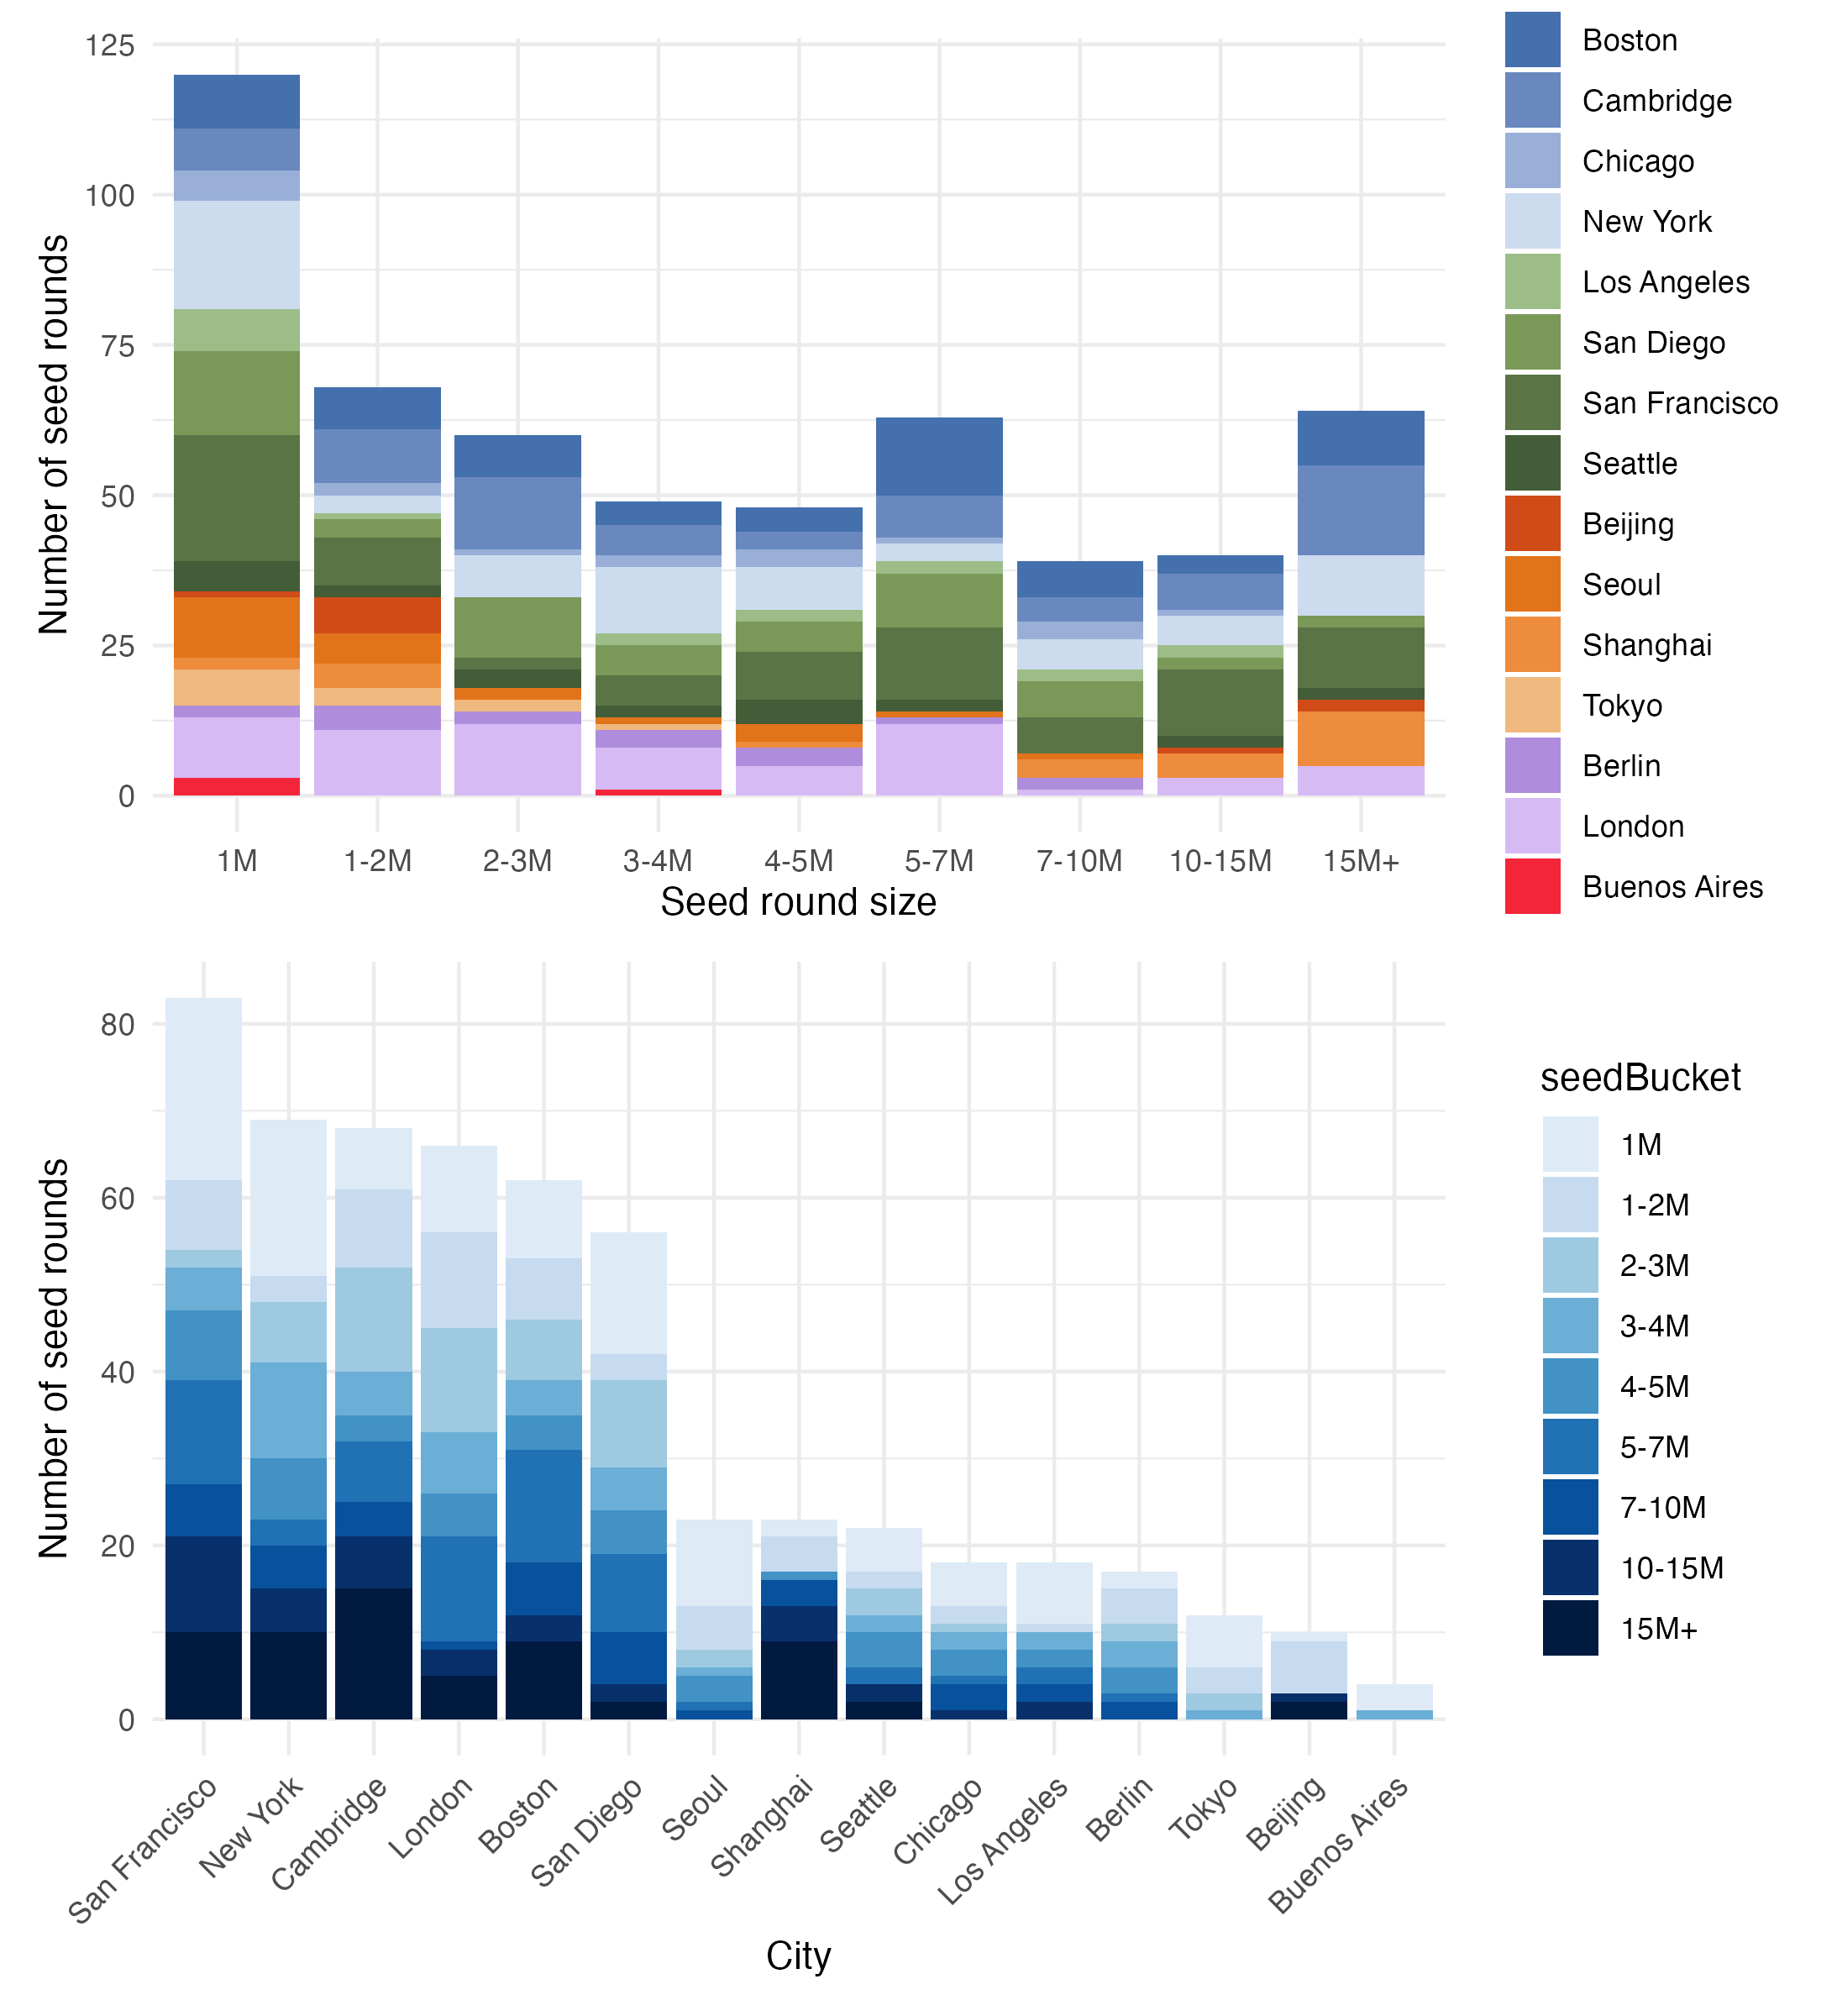
We find that the majority of seed rounds are up to 1M, with traditional biotech hubs like San Francisco, Cambridge, and Boston taking 3 of the top 6 spots for cities raising the most seed rounds. Up and coming hotbeds for biotech including London and San Diego round out the top 6 cities. Outside of the US and London, we see that cities in Asia, including Beijing, Seoul, Shanghai and Tokyo primarily raise up to 2M in seed capital. The majority of companies raising above 2M in seed funding are housed within the US (especially Boston/Cambridge and San Francisco), indicating that larger seed rounds also reflect overall ecosystem maturity and longevity (Figure 1A). Further, these differences may also reflect investor confidence, where local or distal investors feel assured to take a larger bet on a company incubated in the Boston/SF ecosystem compared to companies in smaller cities such as San Diego and London.
This same trend holds true when taking a closer look at the number of seed rounds raised within each city. Again, we find that more established hubs, including San Francisco, Cambridge and Boston, and New York enrich for larger seed rounds (10-15M and 15M+), whereas London and San Diego are more biased toward smaller seed rounds (Figure 1B). This is reflected within the larger, global macroeconomic trends as well, as we see more investors concentrate investments in AI hubs and more validated biotech hubs (San Diego, UK). However, the volume of smaller deals may allow for San Diego and London to weather the storm until venture dollars begin flowing again.
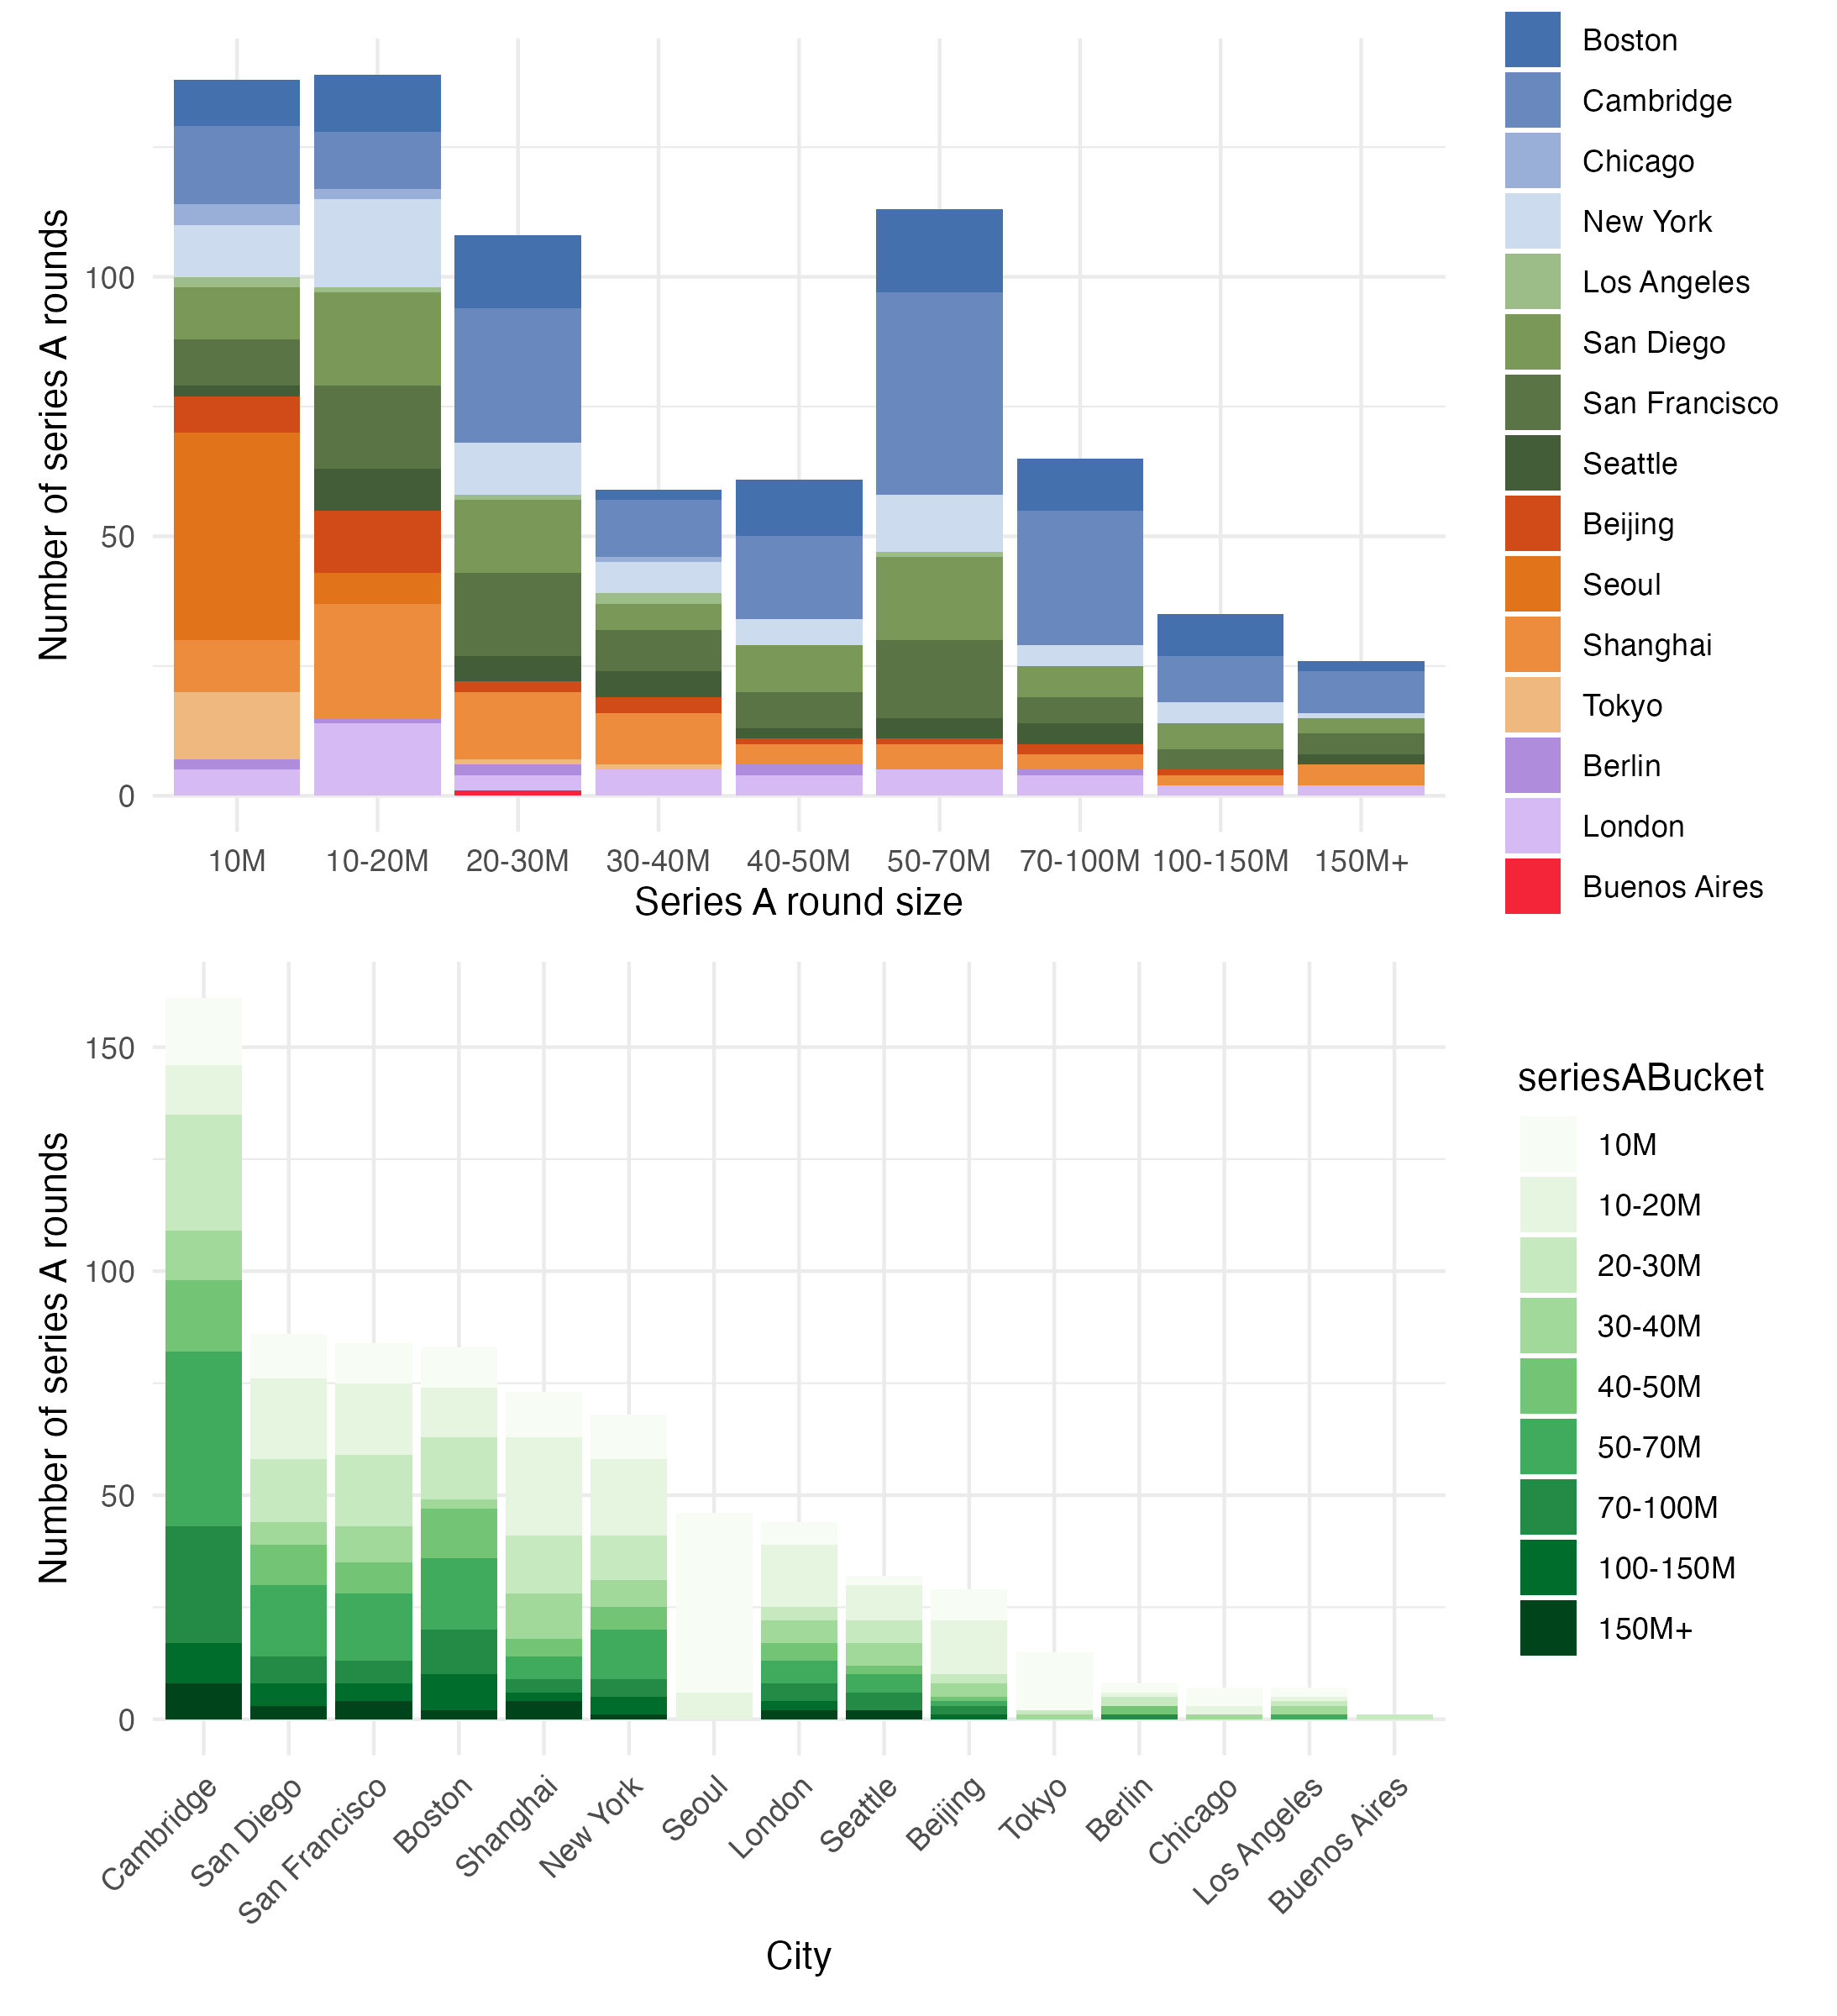
We then looked into the number and size of Series A fundraising in each city. We find that the majority of Series A rounds are up to 10M or 10-20M, indicating a 10x increase from seed to Series A as a common upward trend. Similar to our observations in the seed round, we find that companies based in Asian cities are biased toward smaller Series A rounds (10M, 10-20M), whereas US and EU based companies fill out larger Series A financing rounds (20M+) (Figure 2A). Interestingly, although Cambridge had the third most companies raising seed rounds, it tops the list for Series A financings, almost doubling the number of Series A rounds from the next three cities on the list (San Diego, San Francisco, Boston). This may indicate that different cities and ecosystems have differential efficiencies when transitioning from seed to Series A (Figure 2B).
This again hints toward the importance of the environment where capital is being distributed, not just the companies considered in a vacuum. Boston/Cambridge is almost unparalleled when it comes to innovation infrastructure, with some of the world’s top institutions, top tier talent and a long tradition of life science venture building. We see that this legacy translates into efficiency when transitioning from seed to Series A.
Larger seed rounds may lead to larger Series A, but smaller jumps in fund sizes
To further explore the relationship between seed and Series A financing rounds, we characterized the relationship between seed rounds and Series A for companies with available data for both rounds. We calculated the median fold change between seed and Series A rounds for each city as a measure for how large the difference was between seed and Series A rounds. In other words, this is a measure of how large the median Series A round is in relation to the initial seed round.
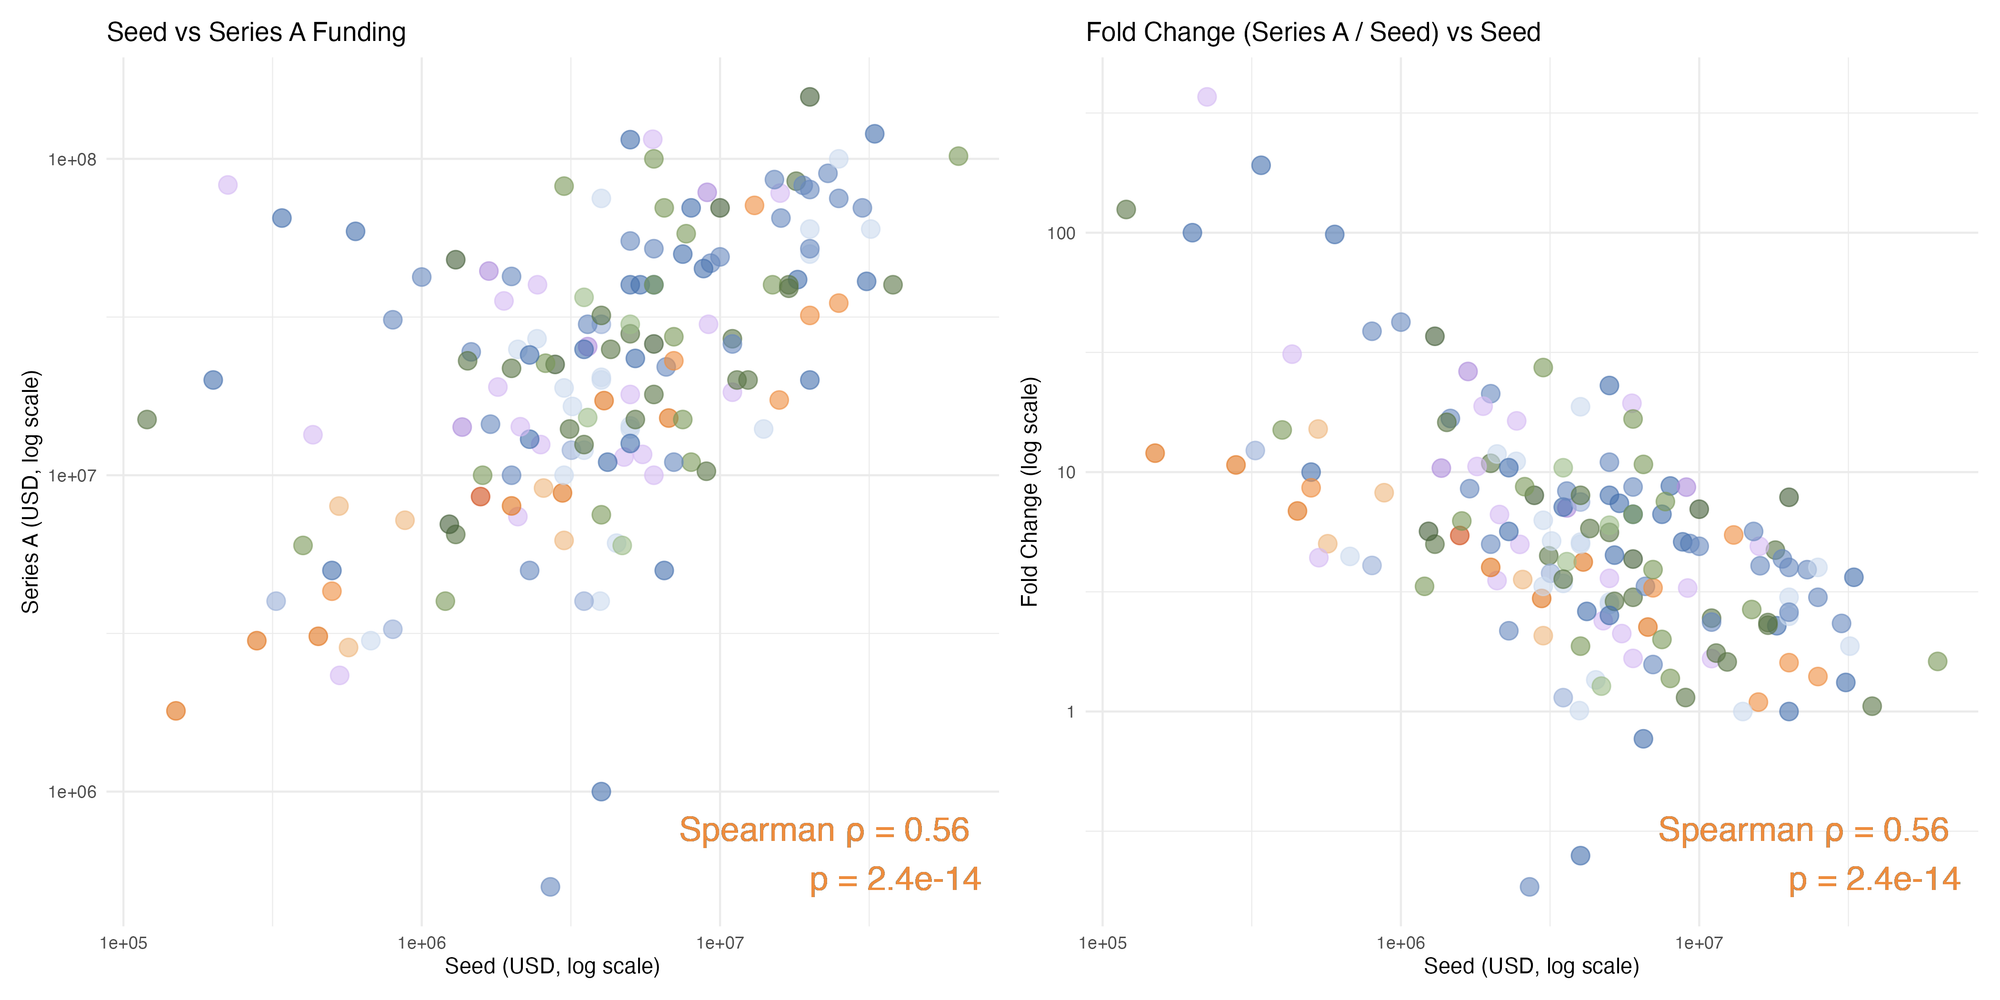
We find a significant correlation between seed and Series A round sizes, indicating that a larger seed round does typically correspond with a larger Series A (Figure 3A). Interestingly, however, we also find that the change from seed to Series A (eg. Series A fund size - seed fund size) has a negative correlation with seed round size (Figure 3B). This indicates that although a larger seed round may lead to a larger Series A, the jump in fund size from seed to Series A may be smaller.
Importantly, we also find outliers when assessing the relationship between seed and series A round sizes. With some companies raising larger Series A rounds than expected, others raised smaller Series A rounds. Together, these data indicate that although there is a pattern for the seed-to-Series A relationship, there is room for companies to break the mold and outraise expectations.
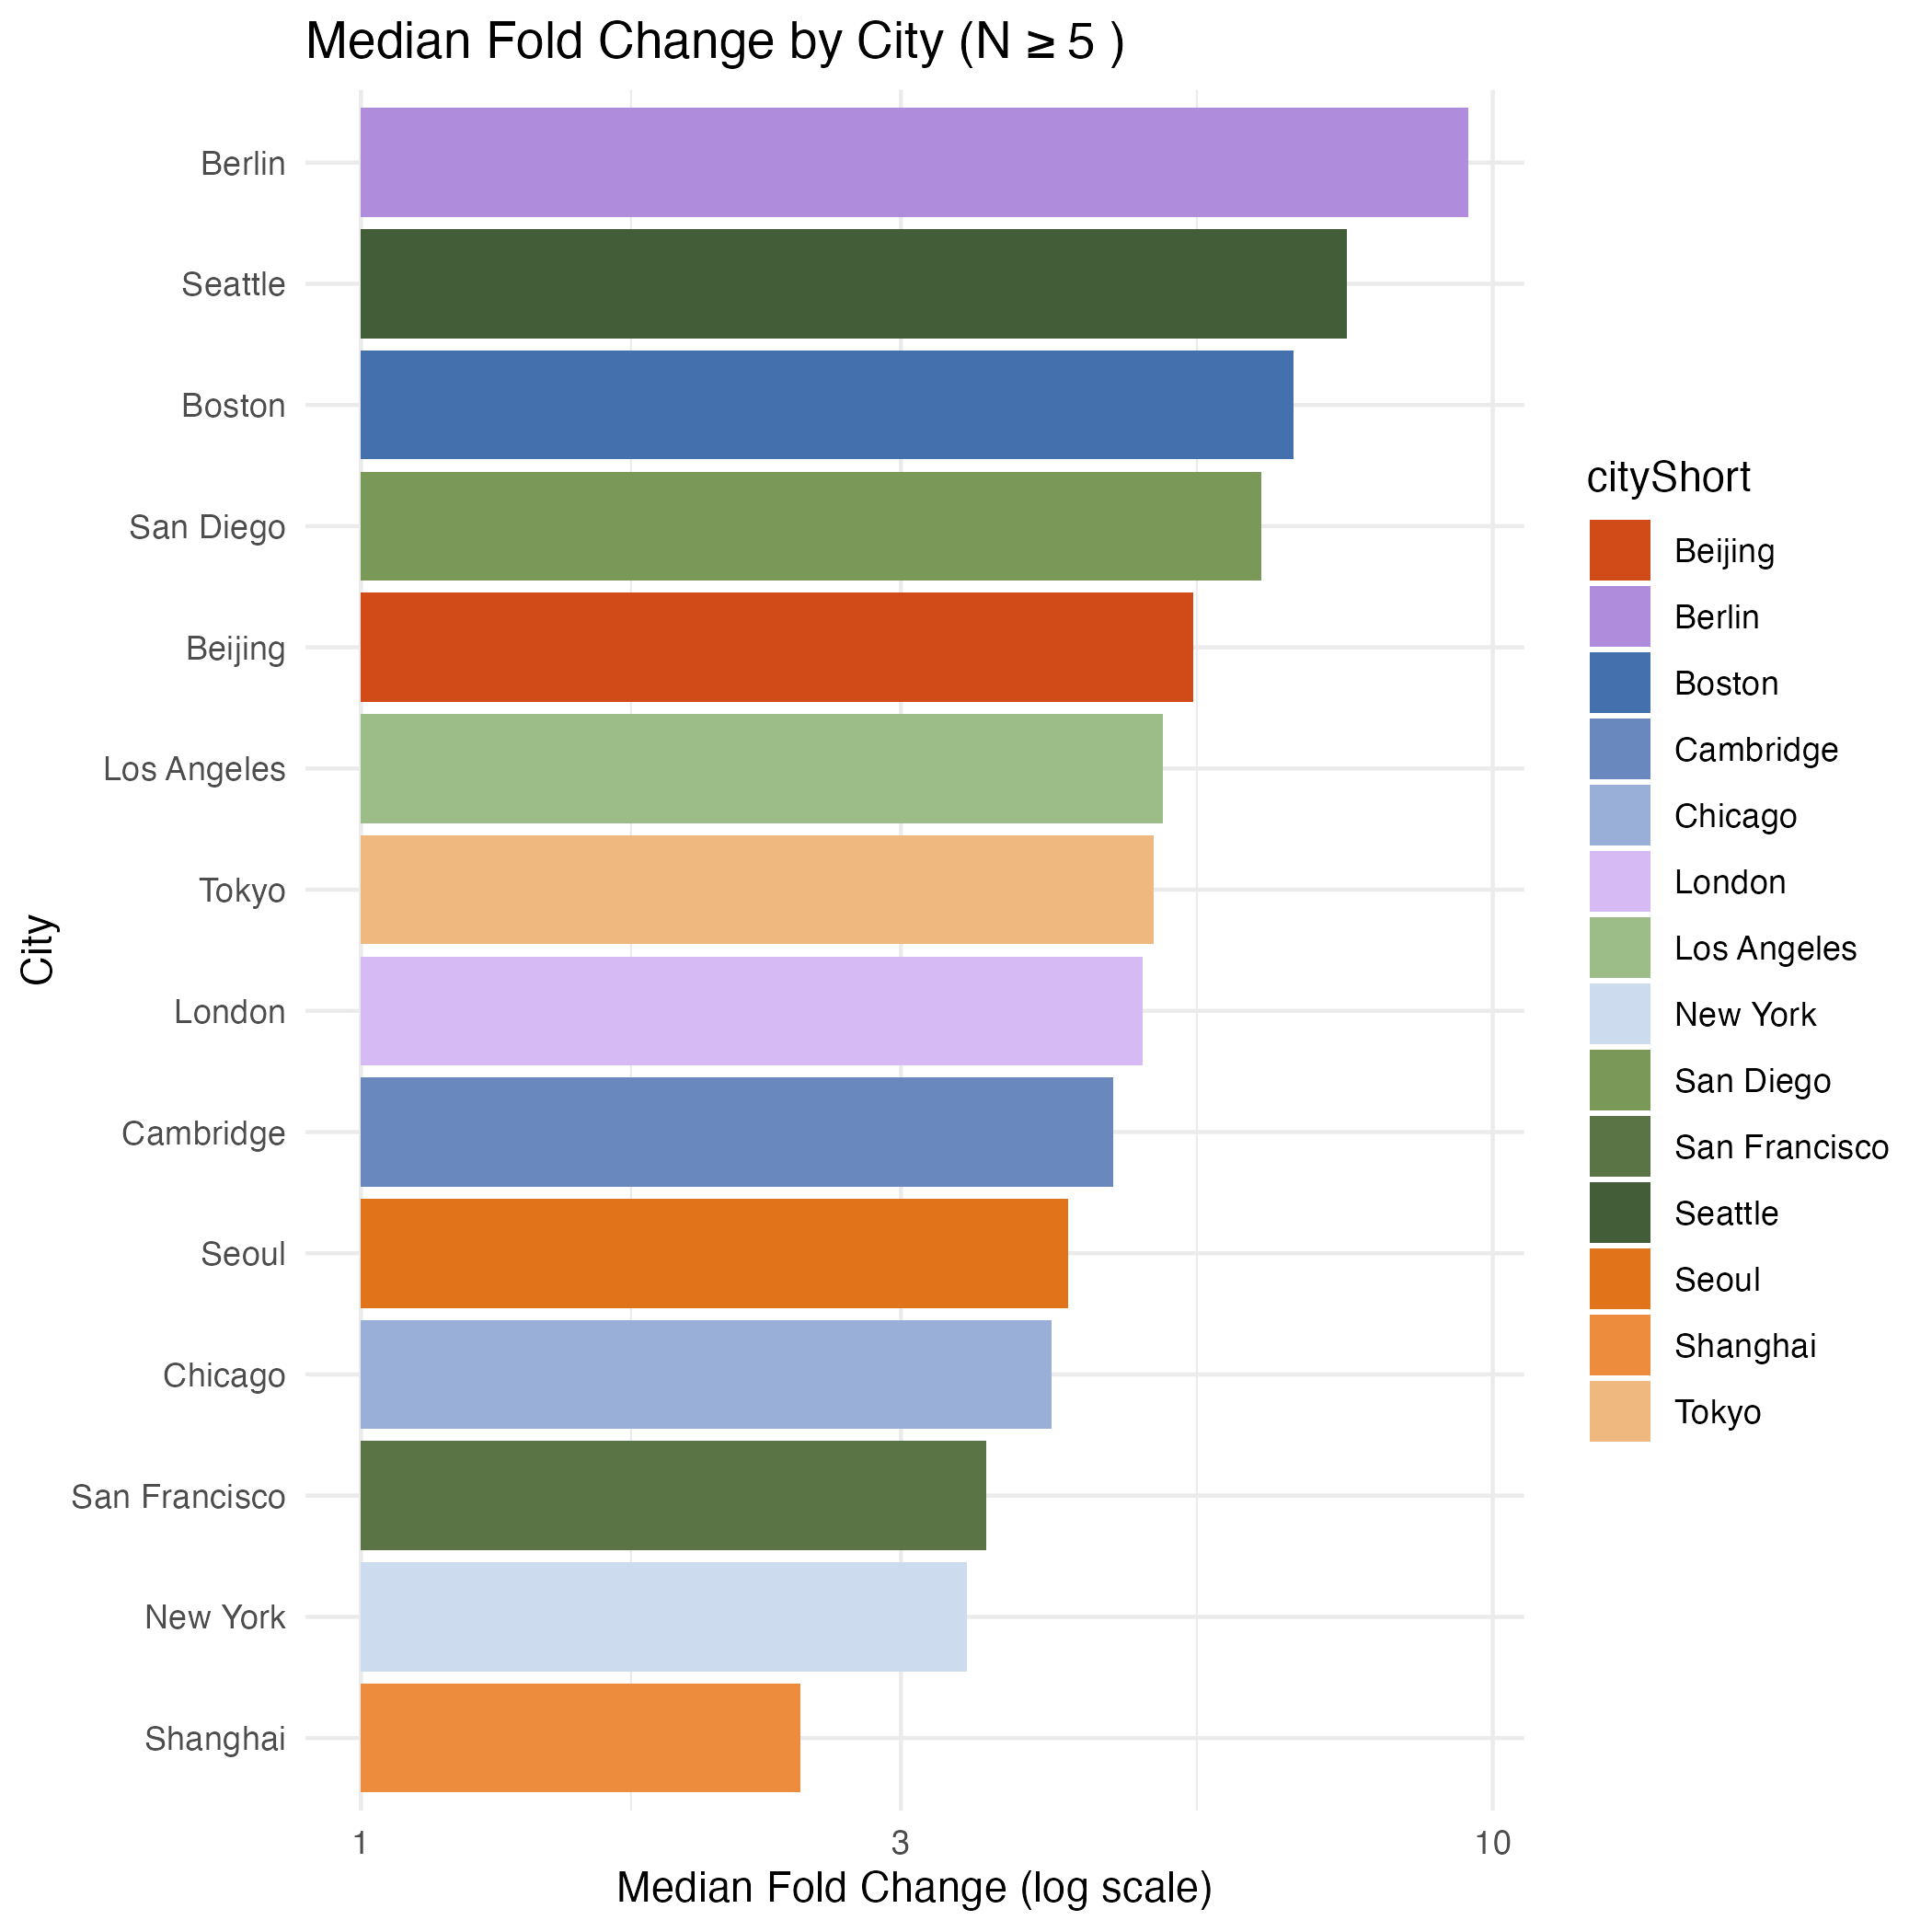
When ranking cities by the median change from seed to Series A, interestingly, we find new cities topping the list, with Berlin and Seattle having the highest median fold change. Boston and San Diego come next, while San Francisco and New York are among the bottom (Figure 4). Together with our previous data, this may indicate that newer biotech ecosystems see larger increases from seed to Series A financing. In overall tougher markets with fewer resources and infrastructure, companies that are able to raise not only a seed round but a subsequent Series A, may represent a more thoroughly vetted and resilient tech, team or both. Teams surviving (and thriving) in more stringent conditions, may reflect the ability to achieve higher levels of capital and resource efficiency.
Ecosystems differ in the quantity and quality of companies raising early rounds
Finally, to compare the quality and quantity of companies raising early financing rounds, we compared the rate of companies with a high seed-to-Series A transition (how many companies have a relatively large jump from seed to Series A financing) and the average change from seed-to-Series A within each ecosystem. These measures allow us to assess how efficient each ecosystem is in terms of 1) producing companies with a high seed-to-Series A jump and 2) the overall funding appetite for early stage start ups.
Using these two metrics, we see that in general ecosystems with a high rate of early stage investments have a high rate of producing companies with a large seed-to-Series A transition. However, we can also loosely characterize ecosystems into groups based on seed-to-Series A fold-change (delta) and average appetite.
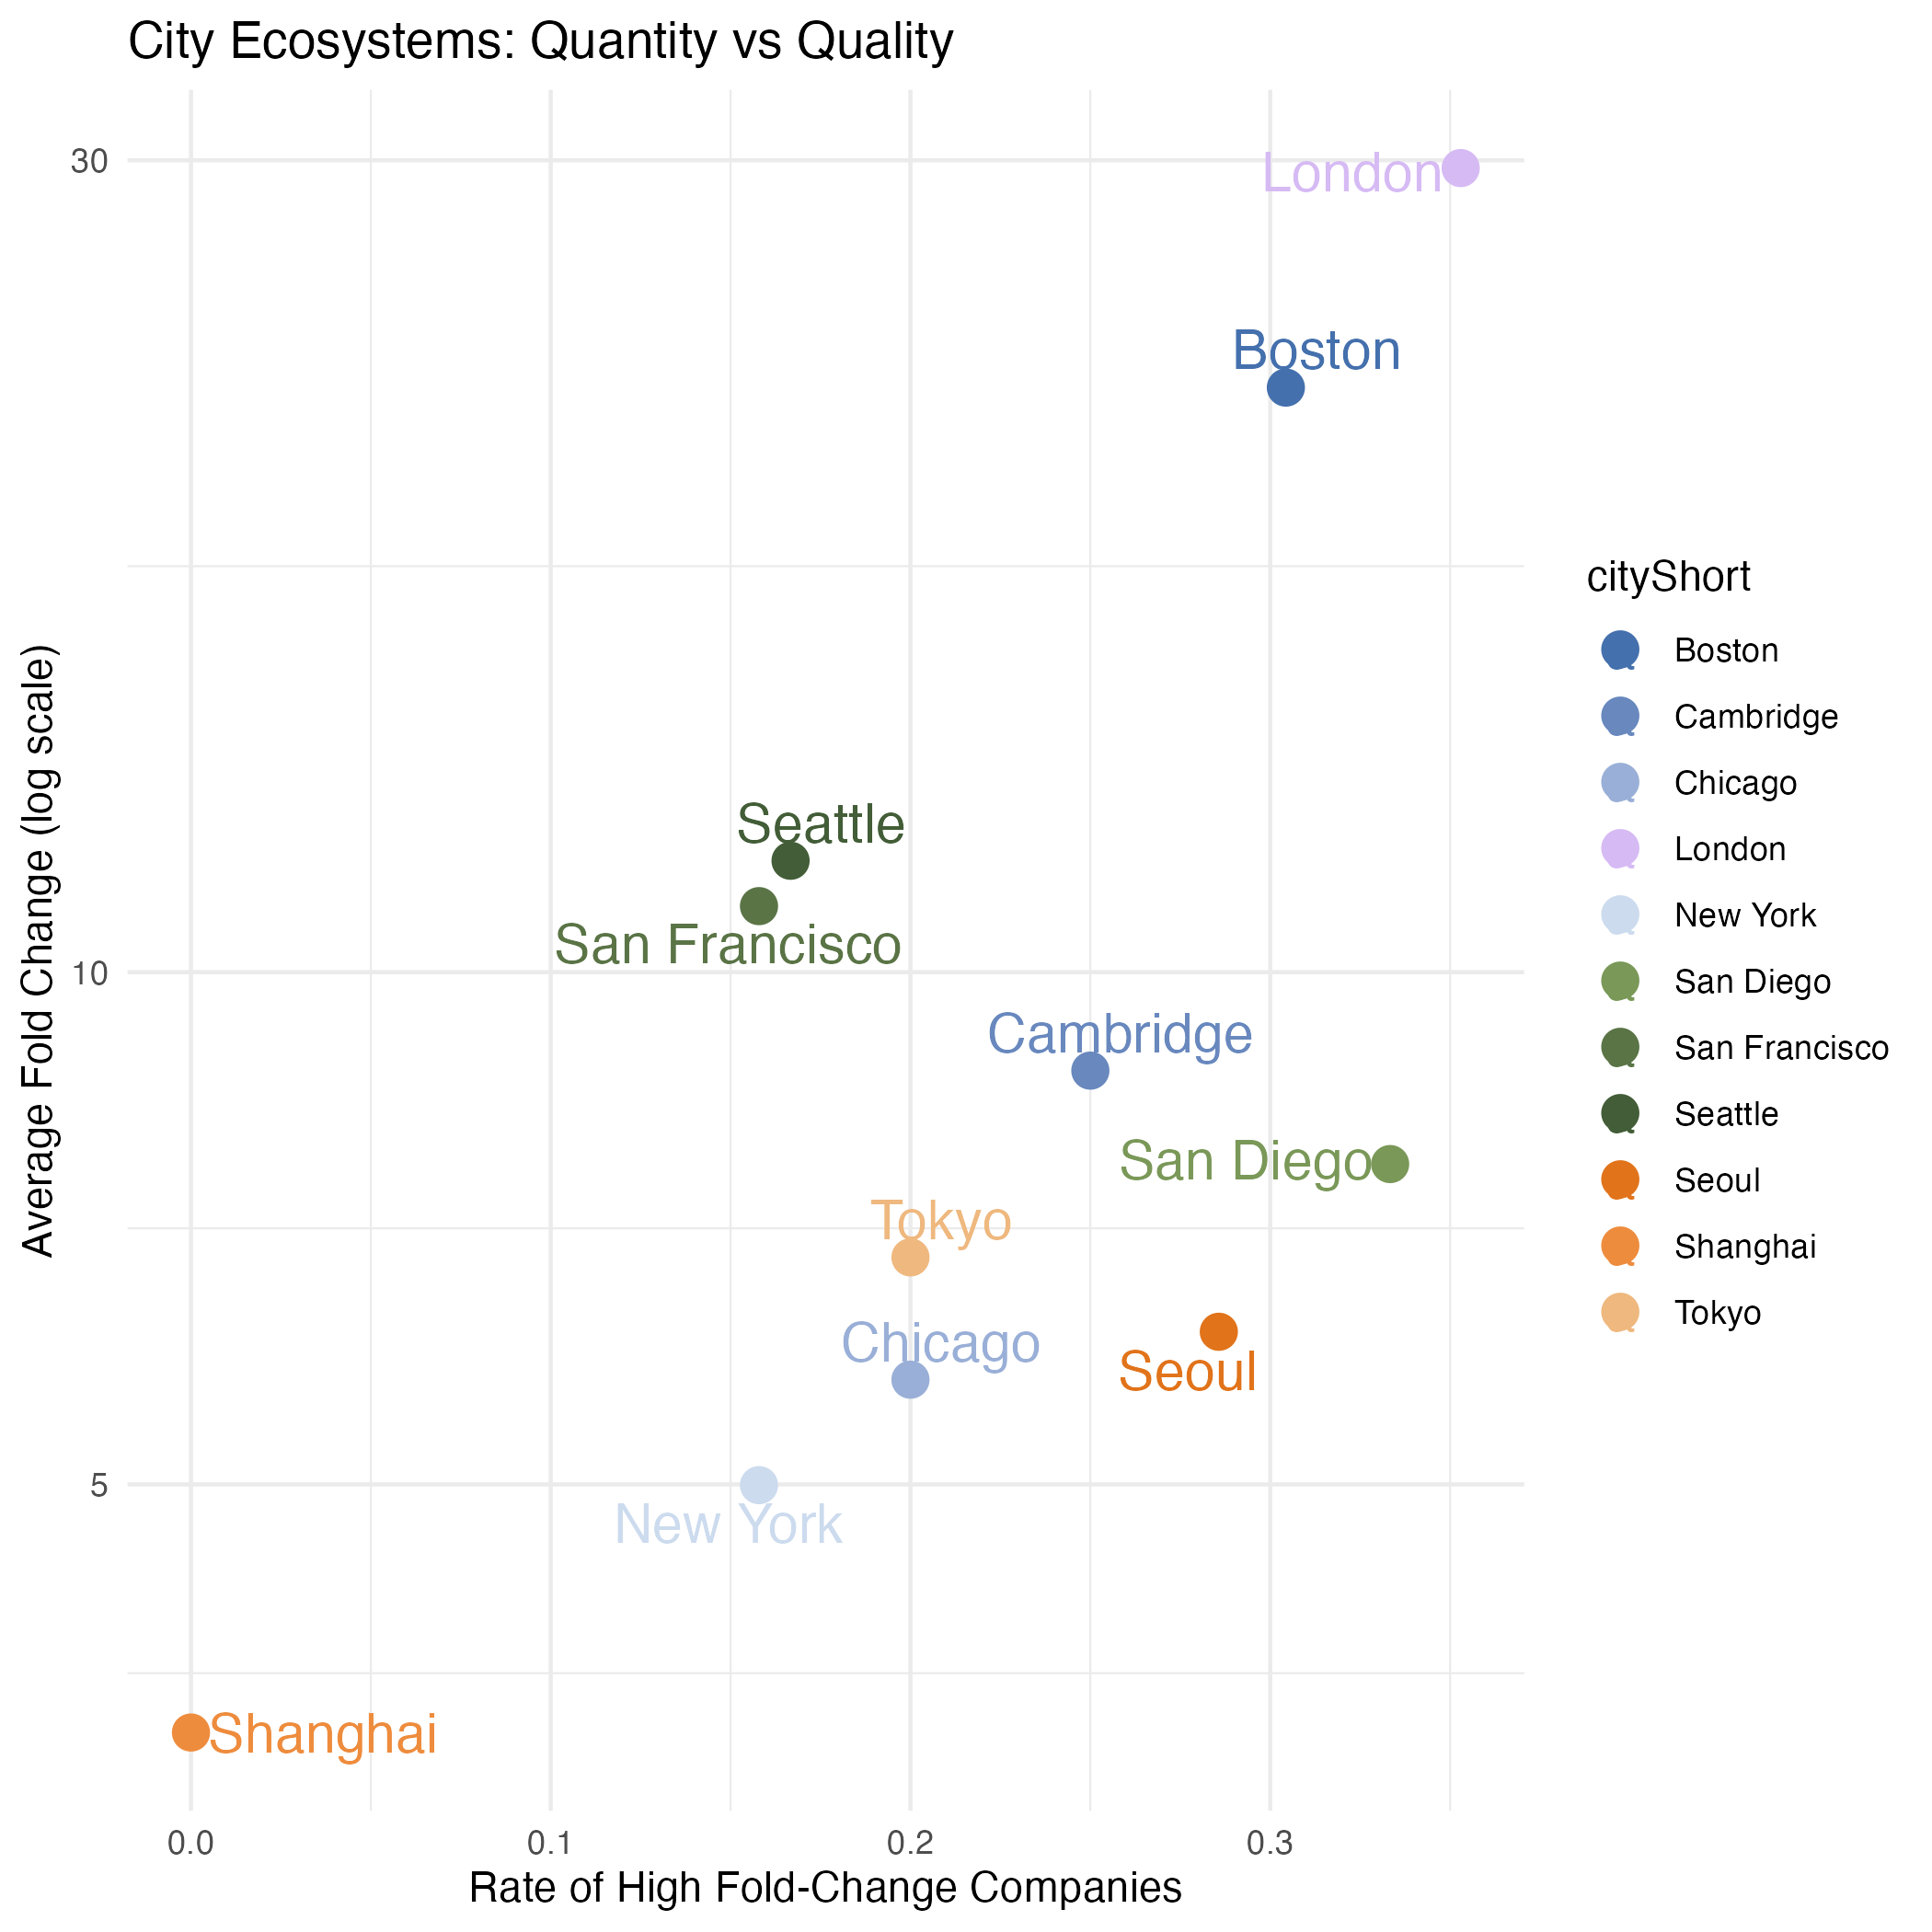
Overall, we see a linear trend between rate of high delta and average seed round, however, we can loosely categorize ecosystems as high/low delta and high/low appetite to reflect general investment dynamics and infrastructure.
High delta & high appetite
Boston and London exhibit ecosystems with a high rate of companies raising comparatively large Series A rounds, even amidst a high average seed-Series A fold change. This category indicates a strong biotech investment ecosystem overall, with a high number of early stage investments and a high rate of companies raising large Series A rounds.
Mid Delta & high appetite
Cities such as Cambridge, San Diego and Tokyo still exhibit a right rate of companies raising relatively large Series A rounds, however their average fold change lags behind Boston and London. This may indicate that although the general influx of Series A capital may be lower in comparison, companies in these cities are still able to raise relatively large Series A rounds. Together this may point to smaller seed rounds utilized with high levels of efficiency or investments that are derisked earlier.
High delta & low appetite
Cities such as San Francisco and Seattle exhibit high average change from seed to series A but are behind in the rate of high fold change companies. This may indicate that these ecosystems benefit from a steadier flow of companies going on to raise series A funding, but with fewer companies making a large jump from seed to Series A.
Although the relationship between delta and appetite are overall positively correlated, we see instances of ecosystems that differ from a 1-1 relationship. This again indicates that there is room for companies in distinct ecosystems to overcome a smaller seed round, and conversely, crumble with large initial captial.
Case Studies
To explore the interplay between seed and Series A fund sizes further, we turned to four different U.S. based case studies spanning both success and failure in biotech and healthcare across initial funding amounts. We restrict these examples to the U.S. to avoid confounding factors and identify variability within a specific ecosystem.
Large Initial Funding, Sustained Success: Sana Biotechnology - Seattle, WA, U.S.A
Sana biotechnology represents an extreme case of early capitalization translating into sustained momentum. Founded in Seattle in 2019, the company raised an extraordinary 700M in initial funding, one of the largest private biotech launches on record. This capital influx allowed Sana to build successful cell and gene therapy platforms, aggressively scale its team, and pursue multiple projects in parallel.
The company continued to demonstrate ambition and produce sound scientific results, leading to investor confidence. In 2021, Sana raised an additional 588M through its initial public offering, one of the largest U.S. biotech public offerings that year. While Sana’s long-term clinical outcomes remain to be seen, its ability to translate early funding into sustained success underscores how large seed rounds can amplify success when paired with strong scientific results and execution.
Large Initial Funding, Eventual Failure: Spotlight Therapeutics - Bay Area, CA, U.S.A
Spotlight Therapeutics offers a counterexample that challenges the notion that early capital translates into successful biotech ventures. Founded in 2018 in the Bay Area, Spotlight raised approximately 66.5M in seed financing, a substantial amount for initial funding.
Despite this strong monetary backing, the company ultimately shut down after generating disappointing preclinical results. The failure was due to the inability of underlying science to meet its therapeutic promise. Spotlight’s path highlights a common pattern in biotech in which capital can buy time and talent, but cannot rescue a program whose biology does not translate. In this sense, large early rounds may delay failure, but do not prevent it.
Small Initial Funding, Sustained Success: Mammoth Biosciences - Bay Area, CA, U.S.A
If Sana represents the power of initial capital, Mammoth Biosciences exemplifies an opposite starting point nonetheless leading to sustained success. Founded in 2017, Mammoth raised just 120K in its seed round, an amount that would barely cover initial costs for many startups.
Yet Mammoth’s foundation rested on groundbreaking CRISPR discoveries emerging from leading academic labs. As the company continued to validate its platform in next-generation gene-editing tools, investor interest scaled rapidly. Mammoth went on to raise multiple large financing rounds, culminating in a 195M Series D and a valuation exceeding 1B. Mamamoth’s story demonstrates that exceptional science can overcome minimal starting capital.
Small Initial Funding, Eventual Failure: Astarte Medical - Yardley, PA, U.S.A
Astarte Medical, founded in Pennsylvania in 2016, unfortunately represents a common outcome in which undercapitalized startups fail to raise further capital. The company raised under 10M in its earliest financing.
Despite a mission focused on improving outcomes for preterm infants, Astarte struggled to raise large subsequent rounds and ultimately ended operations in 2023. Astarte’s challenges appear rooted in the challenge of translating complex clinical interventions into scalable, venture backable businesses. Astatre’s story illustrates that while small initial funding does not predict a company will struggle, insufficient capital combined with high risk can hurt progress, especially in capital-intensive healthcare sectors.
Taken together, these examples challenge common narratives about seed funding. Large initial rounds can accelerate growth, but do not protect a company against scientific failure. Small initial rounds, meanwhile, can translate into success or alternatively limit a company’s ability to navigate inevitable challenges. While early funding shapes the pace of a company’s ventures, it is ultimately the quality of the science and execution that determine where that journey leads.
Conclusion
Taken together, these findings challenge the common assumption that the size of a company’s seed round determines its ultimate trajectory. As seen across global ecosystems, seed funding size varies widely depending on the maturity of the local investment environment, with established hubs often supporting larger early rounds while emerging ecosystems operate with smaller initial capital.
At the same time, ecosystems differ in how efficiently companies transition from seed to series A, highlighting that local investor networks, institutional support, and ecosystem maturity can strongly influence funding dynamics. Although larger seed rounds tend to correspond with larger series A financings, the relative growth between these stages can be smaller, indicating that early capital may restrict the magnitude of later increases.
Ultimately, seed funding shapes the pace and flexibility with which companies navigate early development, but it's not a definitive predictor of success. Instead, the interplay between ecosystem dynamics, scientific quality, and execution determines whether early funding becomes a foundation for sustained growth.
Analysis
The ecosystems selected for this analysis represent a wide spectrum of maturity, regulatory environments, access to talent, and overall capital availability, ranging from established centers like Boston/Cambridge and the San Francisco Bay Area, to rapidly emerging hubs in Asia and Europe.
Funding round data from companies founded between 2015-2025 in our selected cities (Boston, Cambridge, Chicago, New York, Los Angeles, San Diego, San Francisco, Seattle, Beijing, Seoul, Shanghai, Tokyo, Berlin, London, Buenos Aires) was collected from Crunchbase. Funding rounds were placed into buckets (seed buckets: 1M, 1-2M, 2-3M, 3-4M, 4-5M, 5-7M, 10-15M and 15M+, Series A buckets: 10M, 10-20M, 20-30M, 30-40M, 40-50M, 50-70M, 100-150M and 150M+), the total number of funding rounds in each bucket was calculated for each city.
To calculate the correlation between seed and Series A fund sizes, a spearman correlation was calculated for each company with both seed and Series A data available. The correlation between raw seed and Series A and seed and the fold change from seed to Series A was calculated. Additionally, the median fold change from seed to Series A was calculated for each city.
The rate of high fold companies was calculated by summing the number of companies that saw a fold change in the top 25% within their respective city, normalized by overall number of companies.
Hidden Layers Team
| Lead | Lauren Stanwicks |
| Team Members | Romina Horianski, Anisha Sharma, Pranita Atri, Lauren Clubb, Roberto Ogelman, Shivaranjani Balamurugan |