


Written By Lauren Stanwicks, Anisha Sharma, and Shivaranjani Balamurugan
Key Takeaways:
- Corporate assignees hold 85 to 87 percent of granted biotech patents in both the USPTO and EPO systems, meaning most protected biotech innovation is owned by companies rather than universities.
- The academic share of granted patents varies widely by country, from roughly 4 to 24 percent, reflecting real differences in how universities participate in commercialization.
- Venture capital tracks how many patents a country produces, but not where those patents come from: academic patent share tells you almost nothing about how much funding an ecosystem attracts.
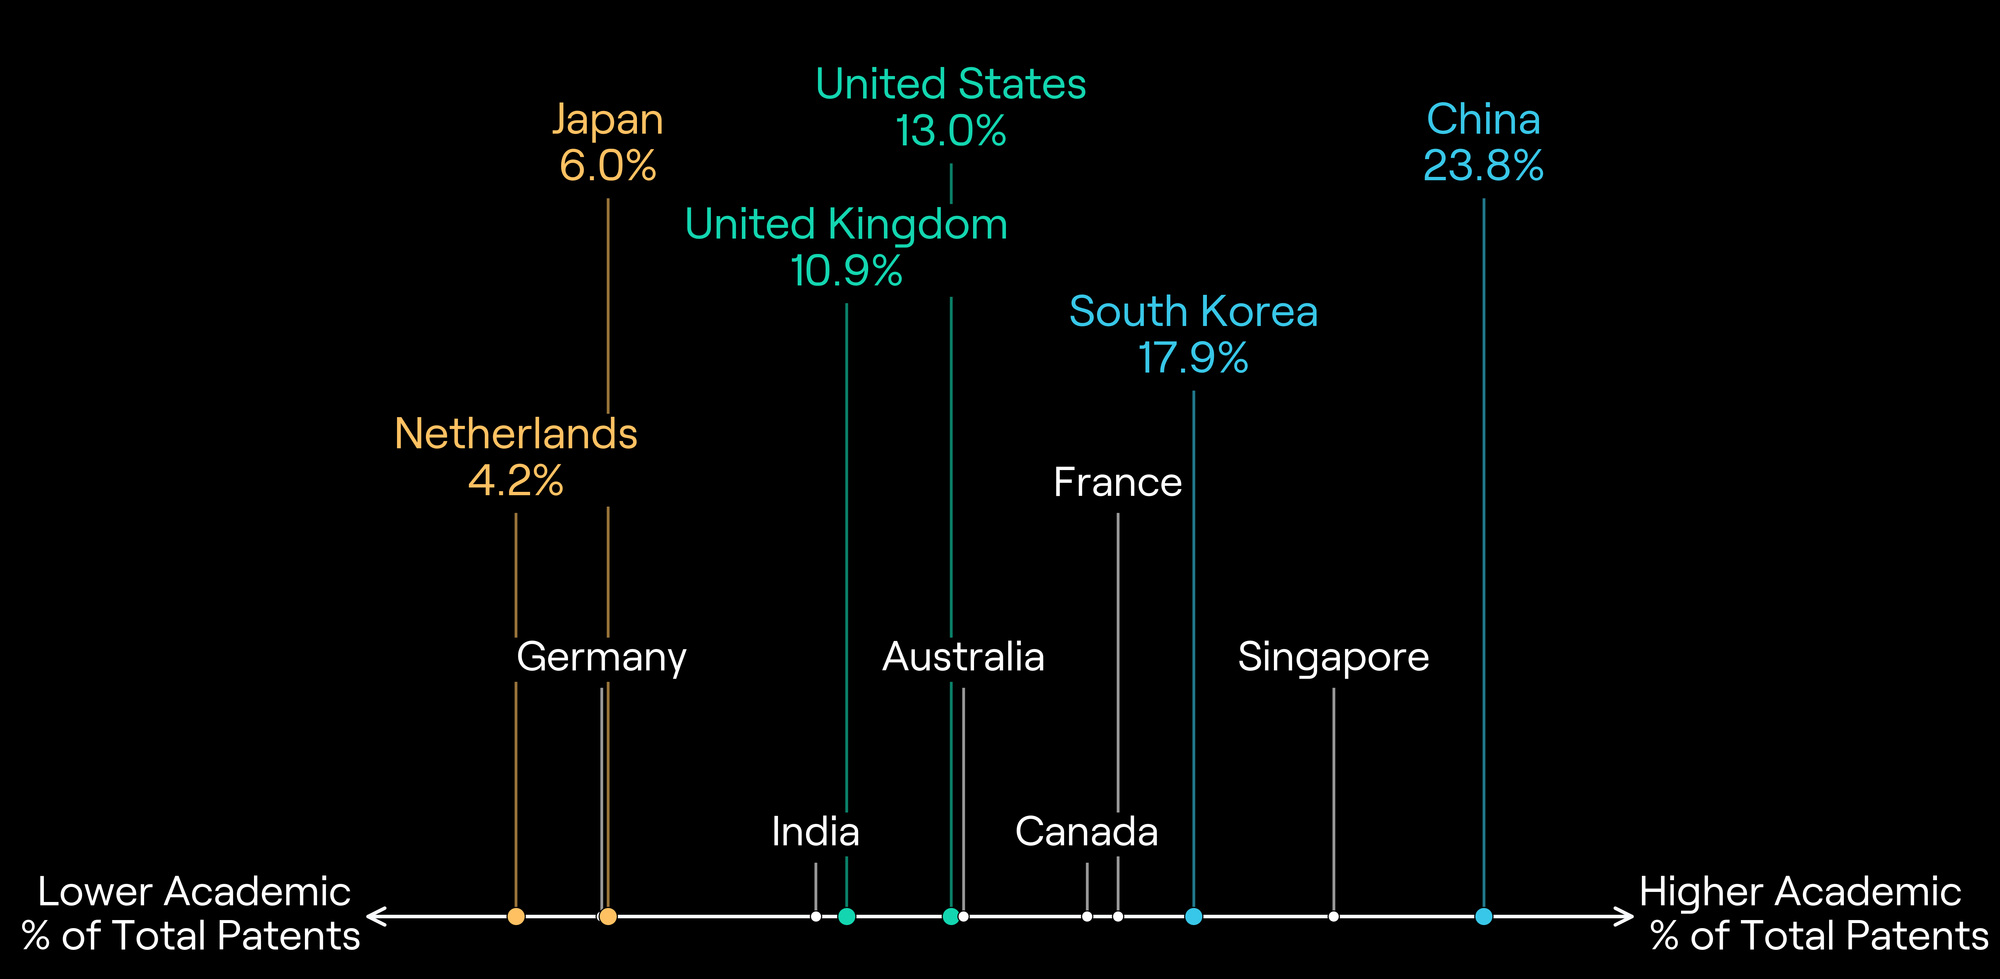
The Academic Share of Biotech Patents
In China, nearly one in four comes from a university. In the Netherlands, roughly one in twenty-four.
Patents as a Proxy for Innovation
In biotechnology, innovation becomes visible through patents. Beyond their legal function, patents are one of the most widely used indicators of where new scientific ideas get translated into technologies and therapeutic platforms. Because patent data is standardized across countries, it offers a useful lens for comparing the strength and structure of global biotech ecosystems [1]. Survey evidence also shows that industries with higher patent counts tend to report greater levels of product and process innovation [2].
But patents do not emerge from a single source. Some originate in universities and public research institutes, reflecting early-stage scientific discovery. Others are filed by companies protecting downstream technologies and commercial development. The balance between these sources varies widely across regions and reflects how different approaches to innovation translate research into economic activity.
Global biotech innovation is also shaped by differences between the patent systems themselves. Two of the most influential jurisdictions are the United States Patent and Trademark Office (USPTO) and the European Patent Office (EPO). Both protect intellectual property, but they operate under different standards. The USPTO allows a 12-month grace period after public disclosure during which an inventor can still file [3]. The EPO permits no equivalent general grace period, so an invention disclosed at a conference or in a preprint before filing may become unpatentable in Europe [3]. For academic inventors, who publish early and often by professional necessity, this difference shapes which jurisdiction is realistically available to them. The dynamics of the two patent offices influence where innovators choose to file patents and how innovation activity appears across jurisdictions, making it important to consider both systems when comparing global biotech ecosystems.
In this analysis, we examine how the origin and jurisdiction of biotech patents shape the structure of global biotech hubs. Specifically, our analysis asks three questions:
- How does the balance between academic and corporate patenting differ across biotech regions?
- Does venture capital follow patent signals, and does that depend on which patent system you look through?
- How efficiently do different ecosystems convert capital into protected innovation?
Together, these reveal how patenting patterns, capital flows, and institutional structures interact to shape where biotech hubs emerge.
Corporate Assignees Dominate Patenting in Both Systems
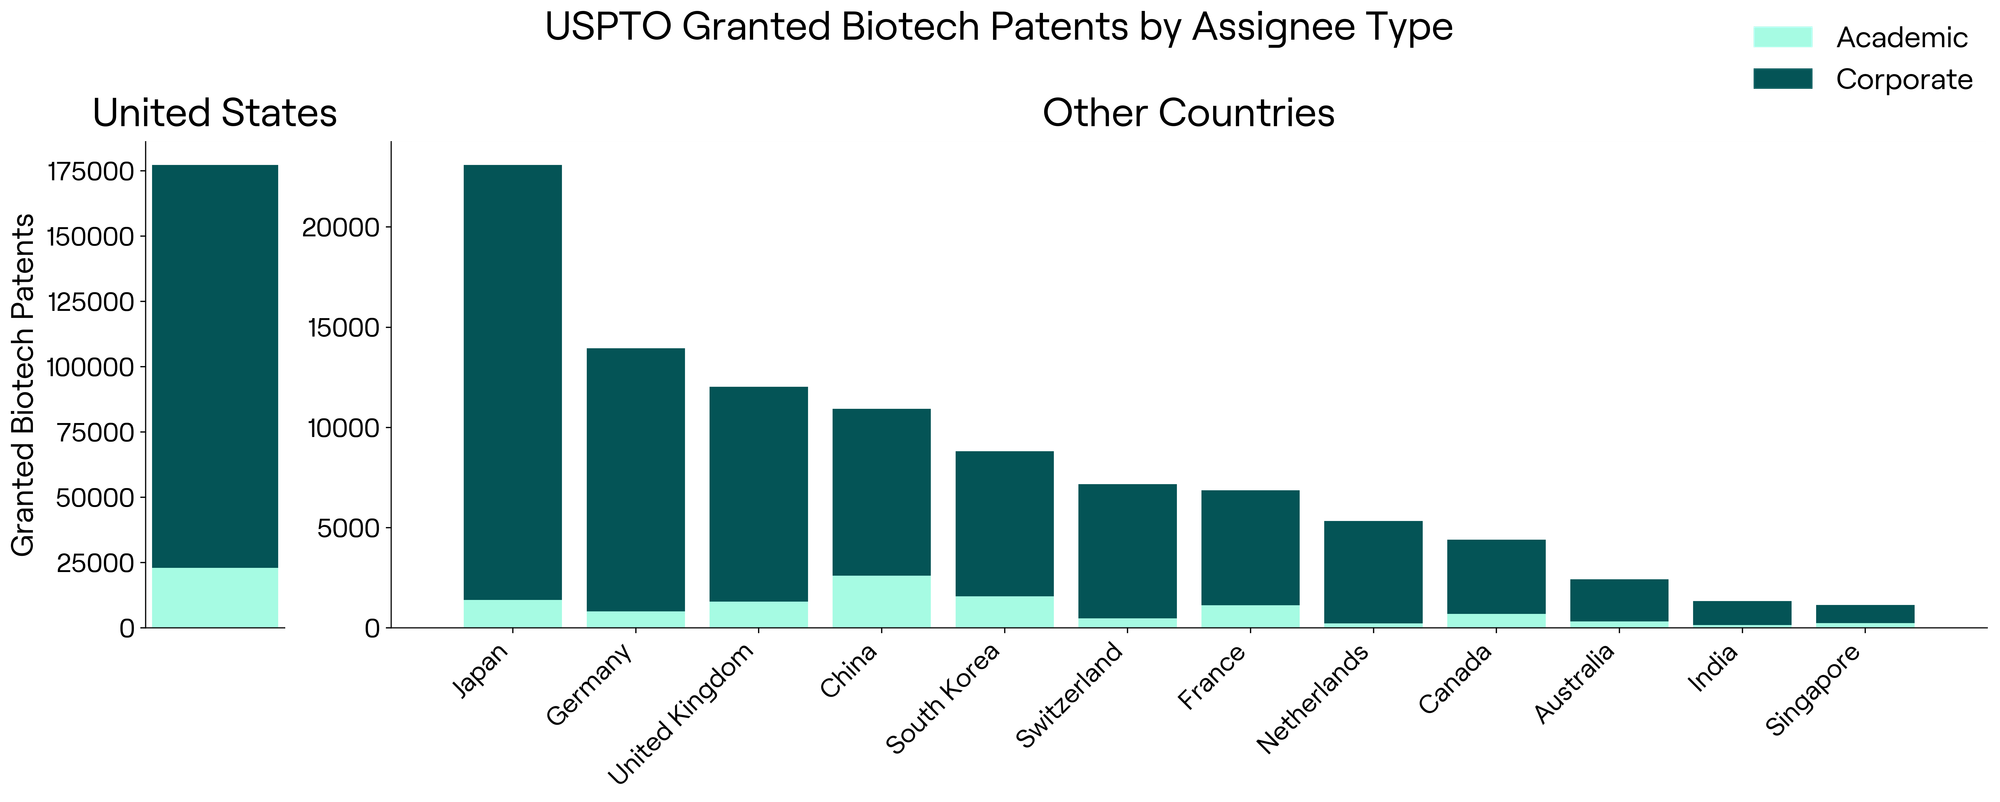
Biotech patenting is highly concentrated. A small number of countries account for the large majority of granted patents in both systems. Figures 1 and 2 above establish a baseline view of how biotech patenting is distributed across countries. Under the USPTO, the United States dominates with 177,261 granted biotech patents between 2020 and 2024, far ahead of any other country. Japan, Germany, the United Kingdom, and China form a distinctly lower tier, each clustering in the 10,000 to 20,000 range, while Canada, Australia, India, and Singapore sit in the low thousands.
The same hierarchy appears in EPO grants, reinforcing the position of the United States, Japan, and Germany as leading biotechnology nations. Absolute counts differ between the two offices, but the ranking of major biotech economies is largely consistent.
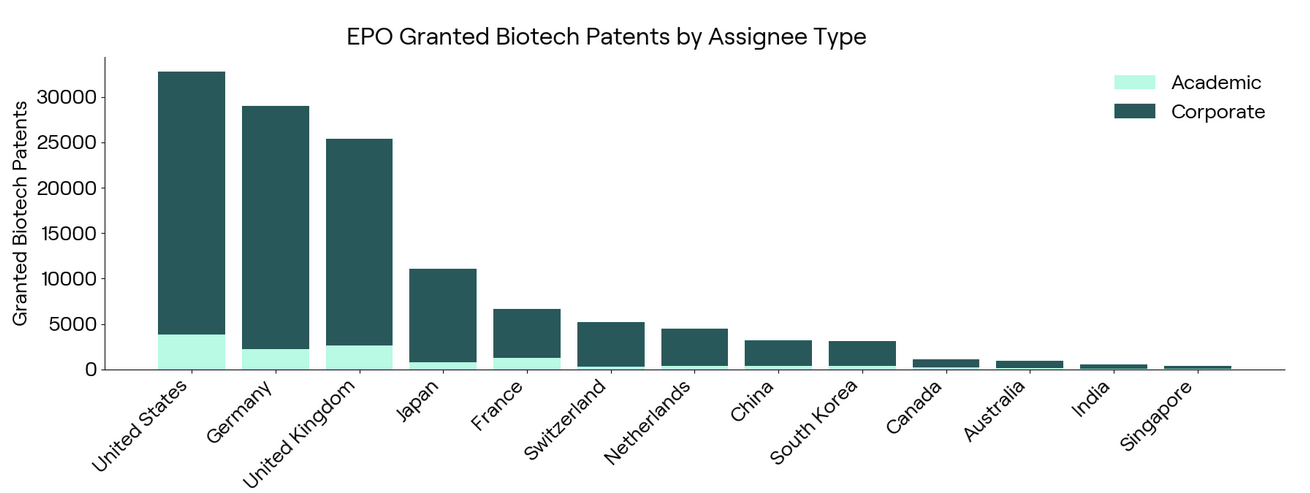
Across both offices, the overwhelming majority of granted biotech patents are assigned to corporate entities: between 85 and 87 percent are held by companies rather than universities or public research organizations. Scientific discovery may originate in both academia and industry, but formal ownership of intellectual property, along with the right to develop and commercialize it, is concentrated in private firms.
Academic Participation Varies Widely by Country
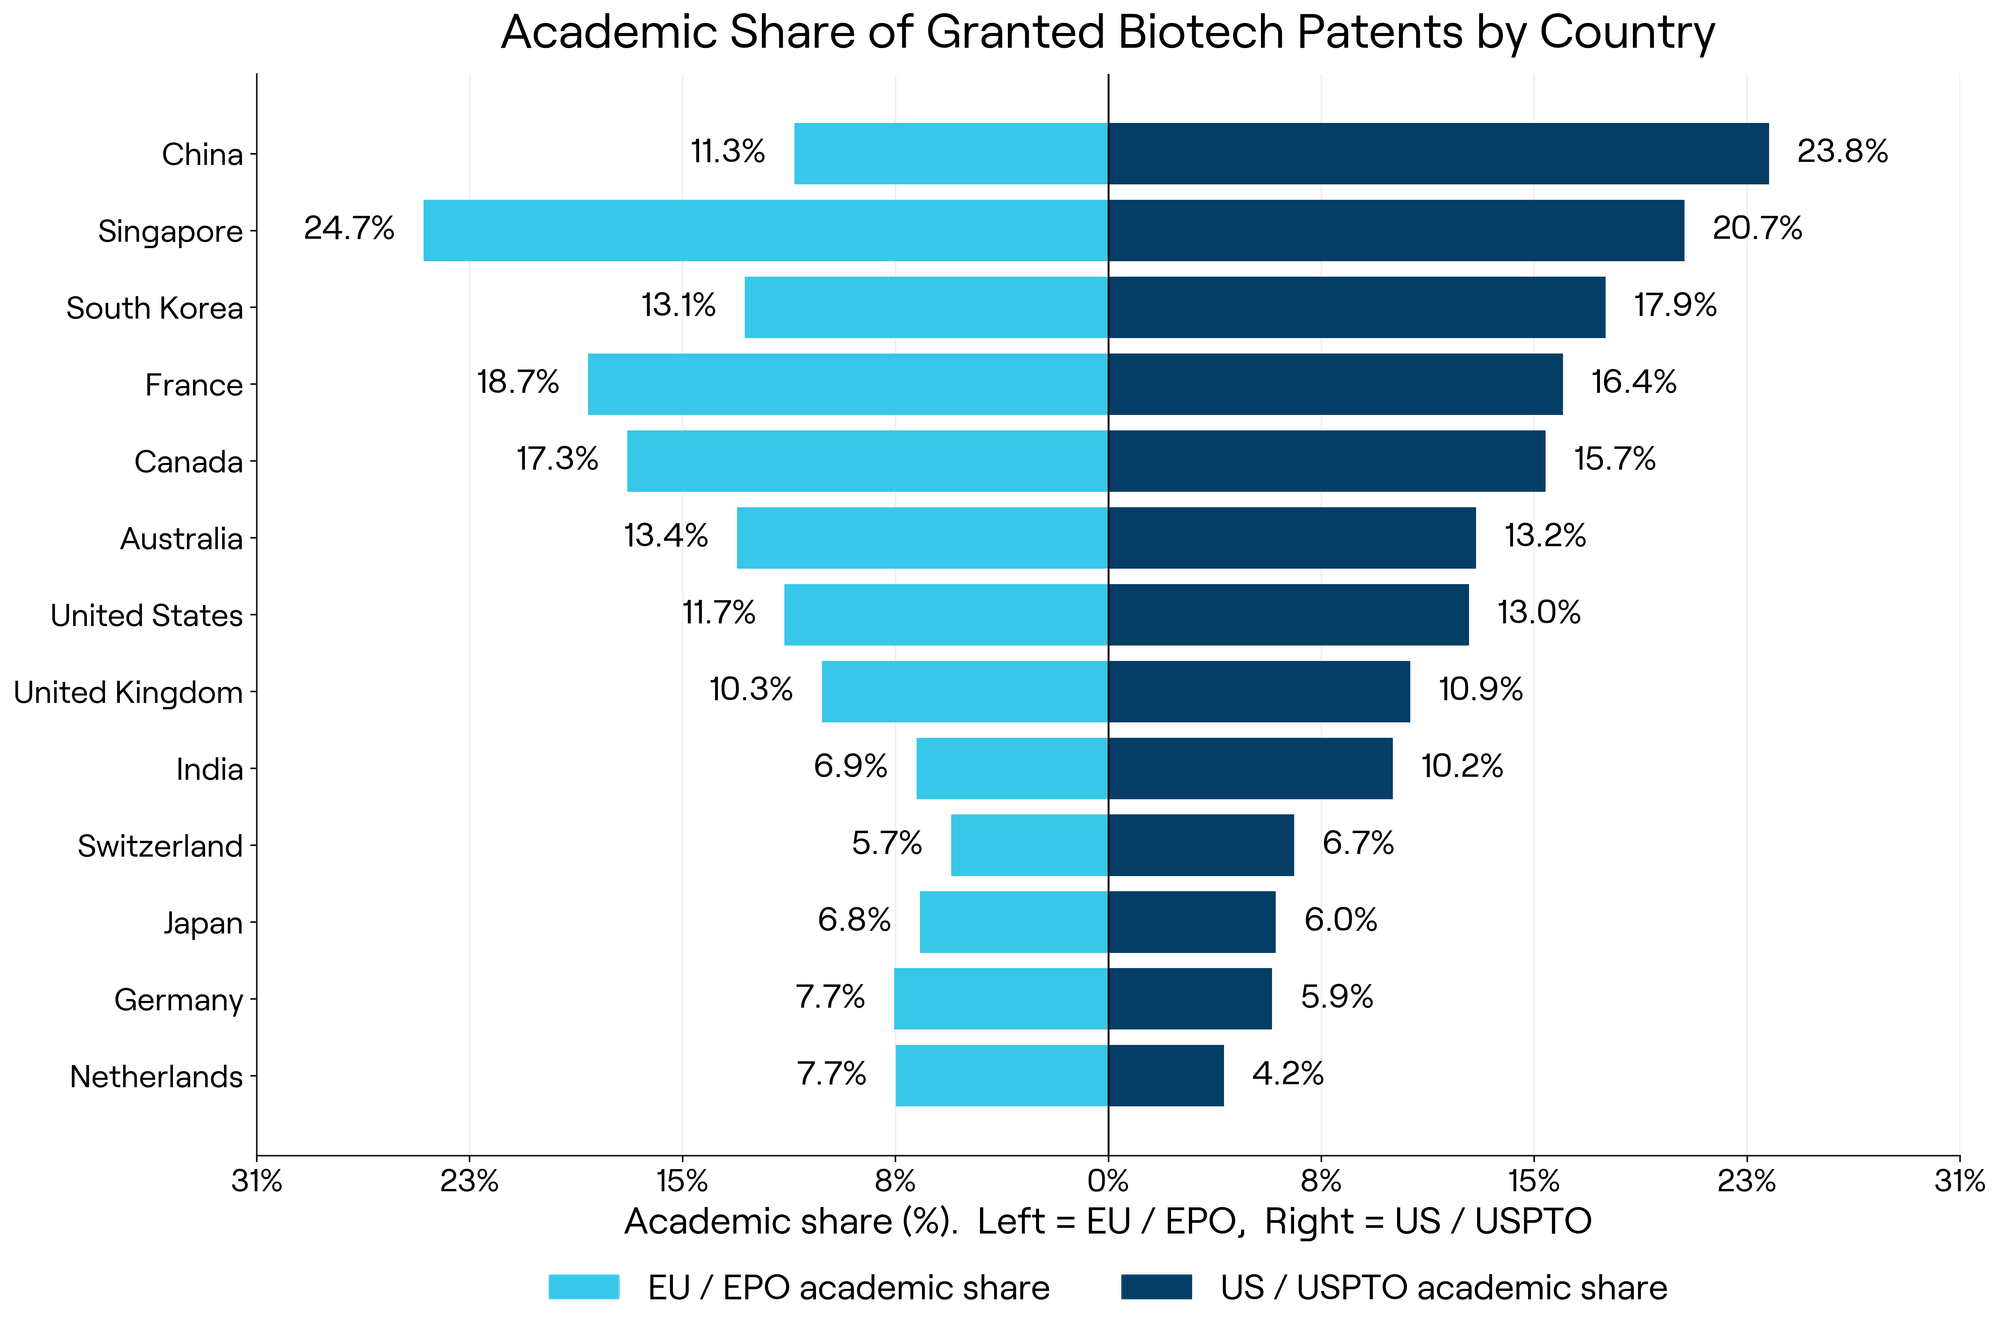
Figure 3 compares the proportion of granted patents assigned to academic institutions in each system. Academic participation varies substantially across both countries and jurisdictions.
Across all 13 countries in our dataset, the academic shares in the two systems are strongly correlated (r = 0.88, p < 0.0001). Countries with high academic participation in one office tend to show high participation in the other. But this pattern is not uniform. Among the five European countries, the two shares move almost in lockstep (r = 0.93, p = 0.02), while among the eight non-European countries the relationship is weaker and not statistically significant (r = 0.61, p = 0.11). In other words, the academic share of patents granted in the United States does not reliably predict the academic share granted in Europe for non-European countries. With samples this small, we treat this contrast as suggestive rather than established: five countries is not enough to characterize a continent, and a difference in significance between two correlations is not the same as a significant difference between them.
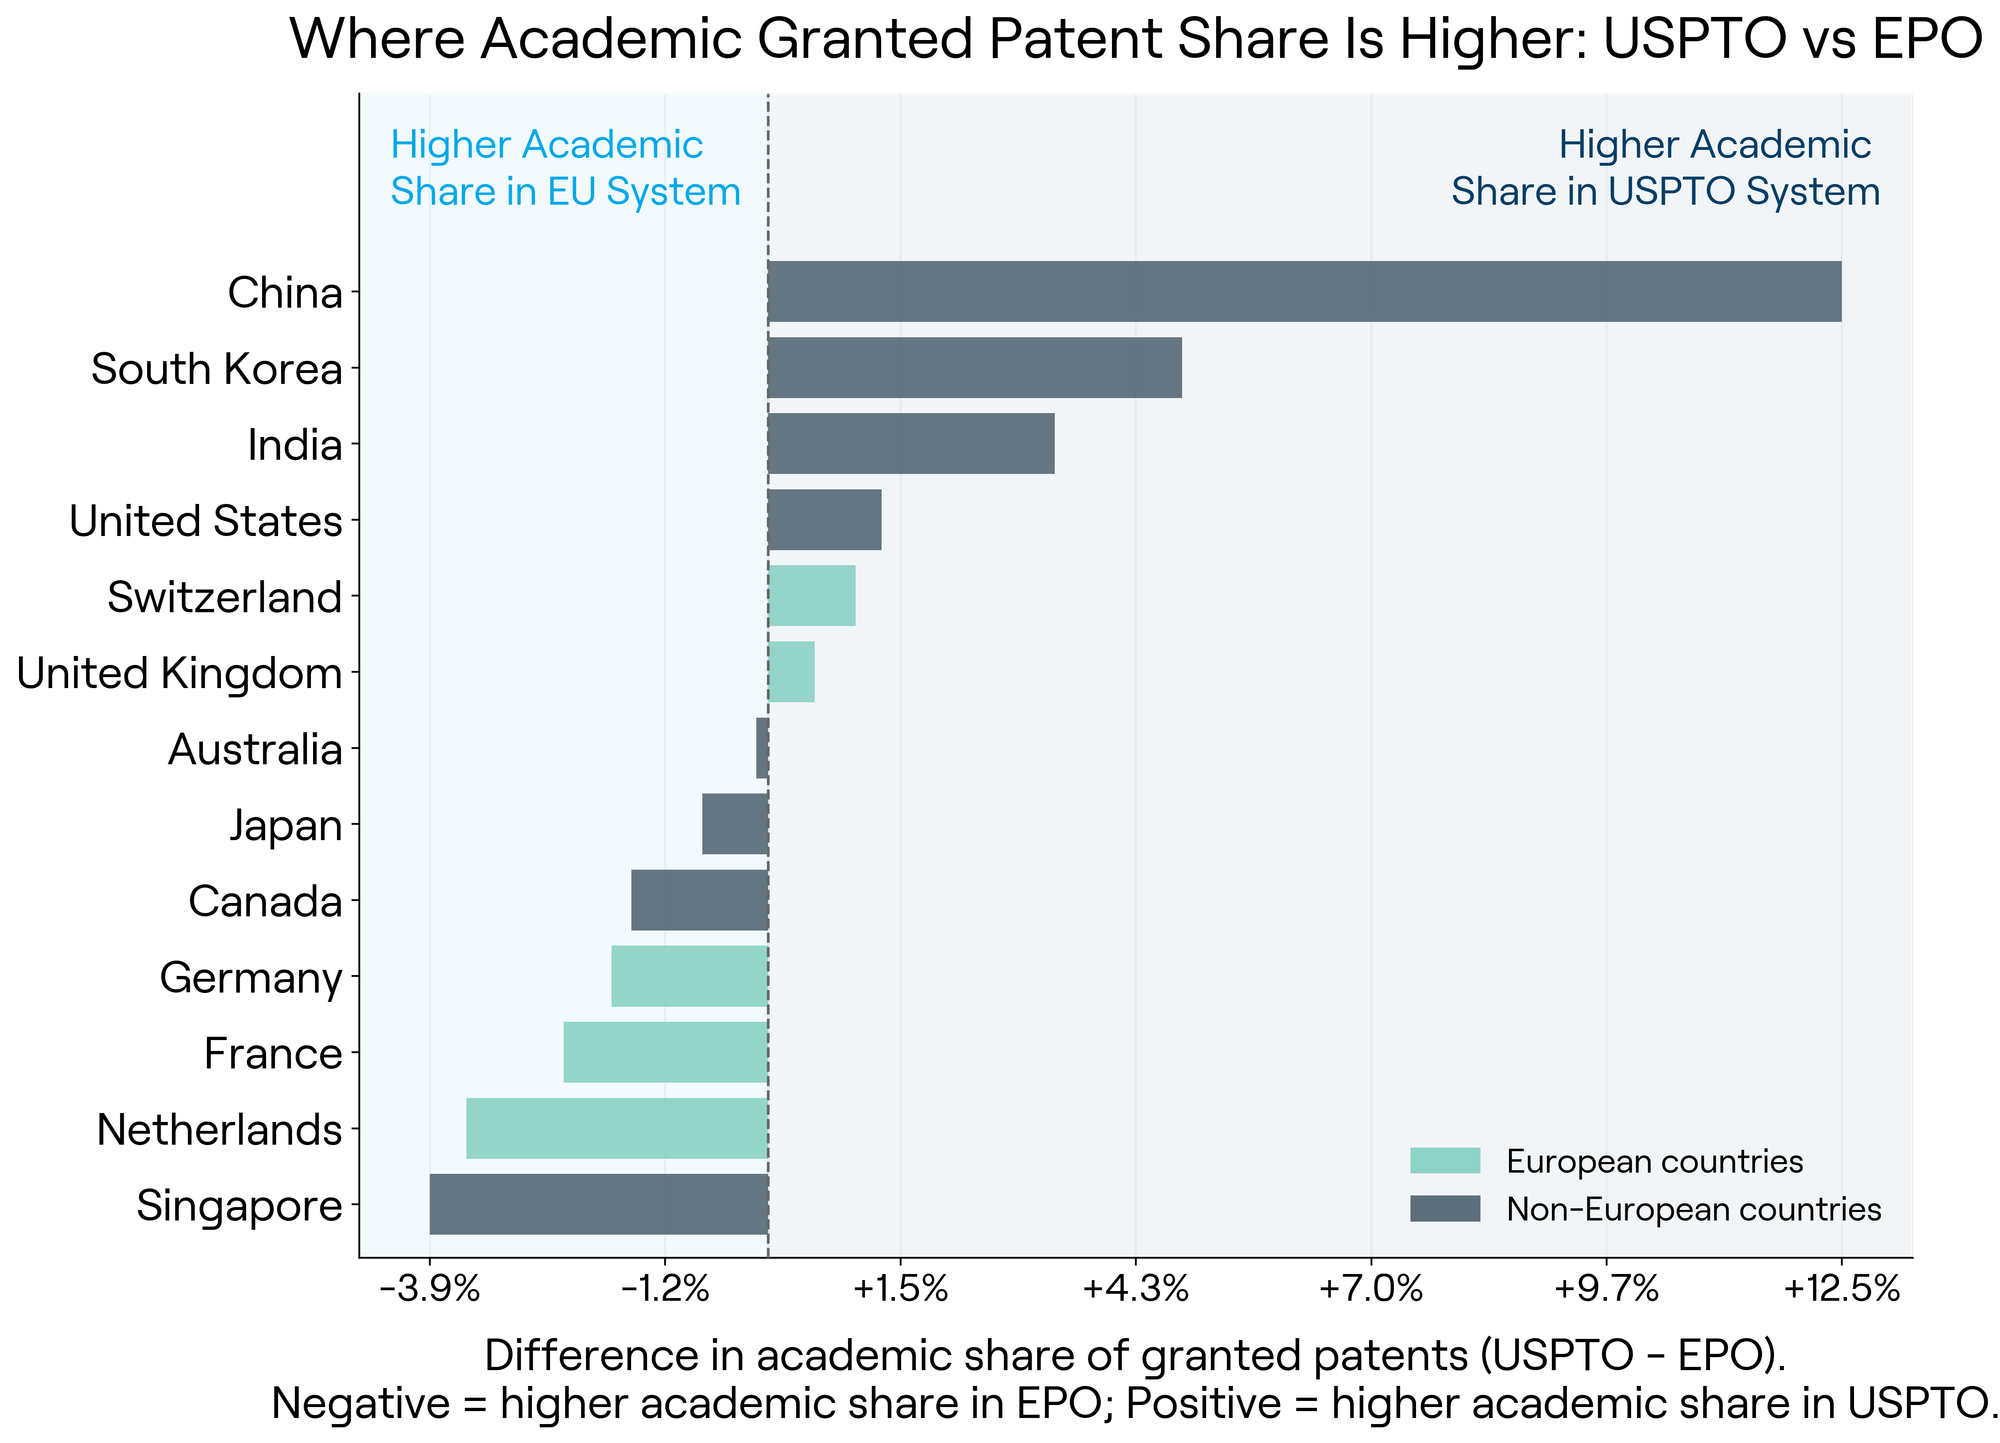
Figure 4 shows the country-level gaps directly, and these stand on their own. For several non-European countries, notably China, South Korea, and India, academic institutions account for a considerably larger fraction of USPTO grants than of EPO grants. Two mechanisms could produce this. Academic inventors in these countries may be filing in the United States at higher rates than in Europe, plausibly because the USPTO grace period accommodates a publish-first workflow. Alternatively, their domestic corporations may be concentrating European filings more heavily, mechanically shrinking the academic share there. Our data cannot separate these, and the distinction suggests the first is a story about universities and the second is a story about companies. European countries show much smaller gaps between the two systems, which is unsurprising given that the EPO is their home jurisdiction and the strategic calculation of where to file first is different.
Venture Capital Follows Patent Volume, Not Academic Origin
To see how venture capital aligns with national innovation activity, we compared venture capital per capita against two different patent indicators: overall patent density, and the academic share of granted patents. The two comparisons give very different answers.
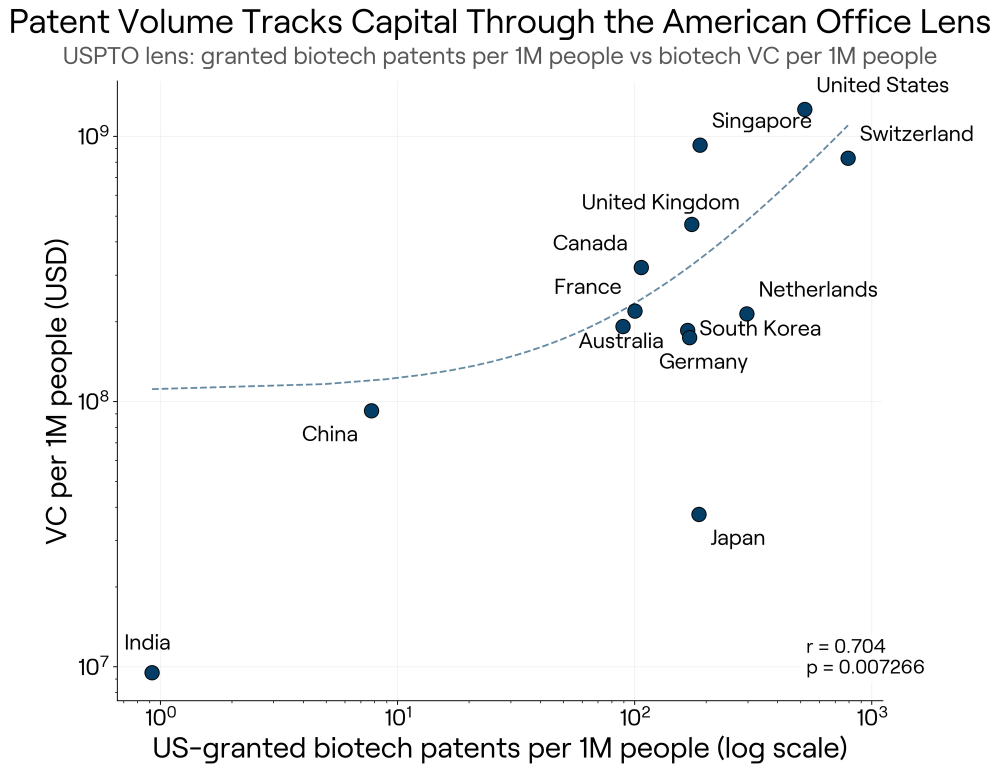
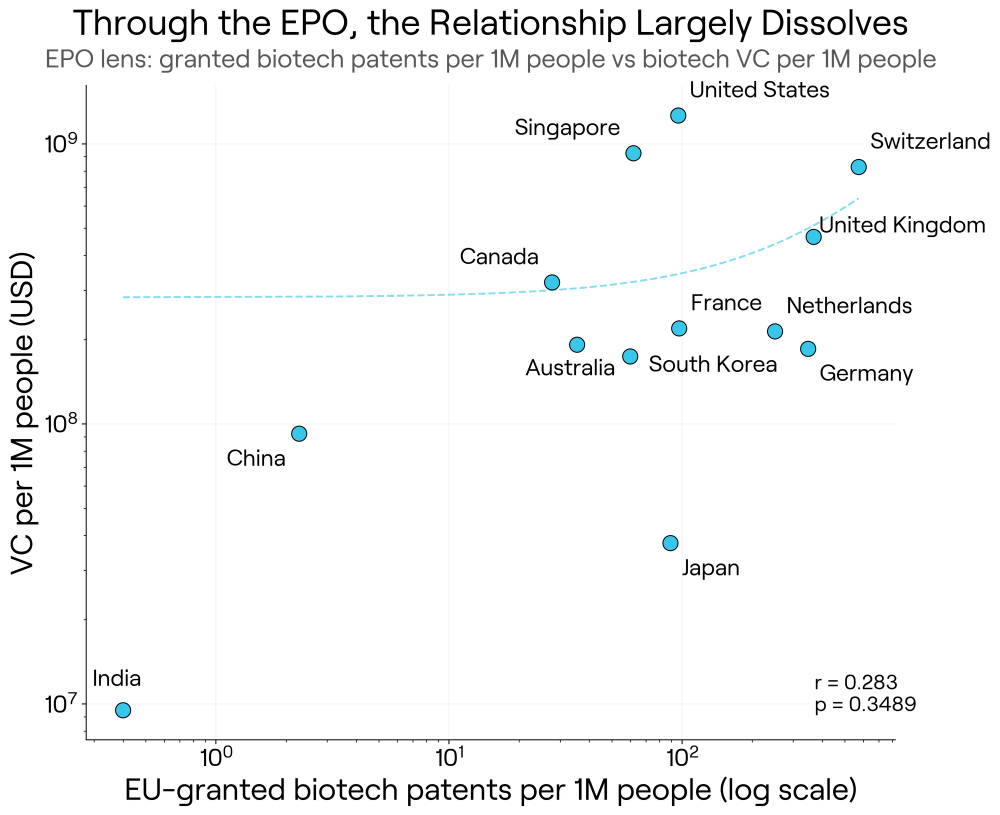
Patent volume tracks capital, at least through the American lens. Countries producing more biotech patents per capita under the USPTO attract more venture funding per capita (r = 0.72, p = 0.006; Figure 5). Measured through the EPO, that relationship largely dissolves (r = 0.31, p = 0.30; Figure 6). The contrast between the two panels is the finding: under the US lens the points climb a clear upward curve, while under the European lens they flatten into a cloud. Note that both plots use a log scale on the horizontal axis, so the spread in patent output is even wider than it looks. One reading is that global venture markets respond more strongly to innovation signals visible in the U.S. patent system, whether because U.S. filings are a better proxy for commercial ambition or simply because investors watch that system more closely.
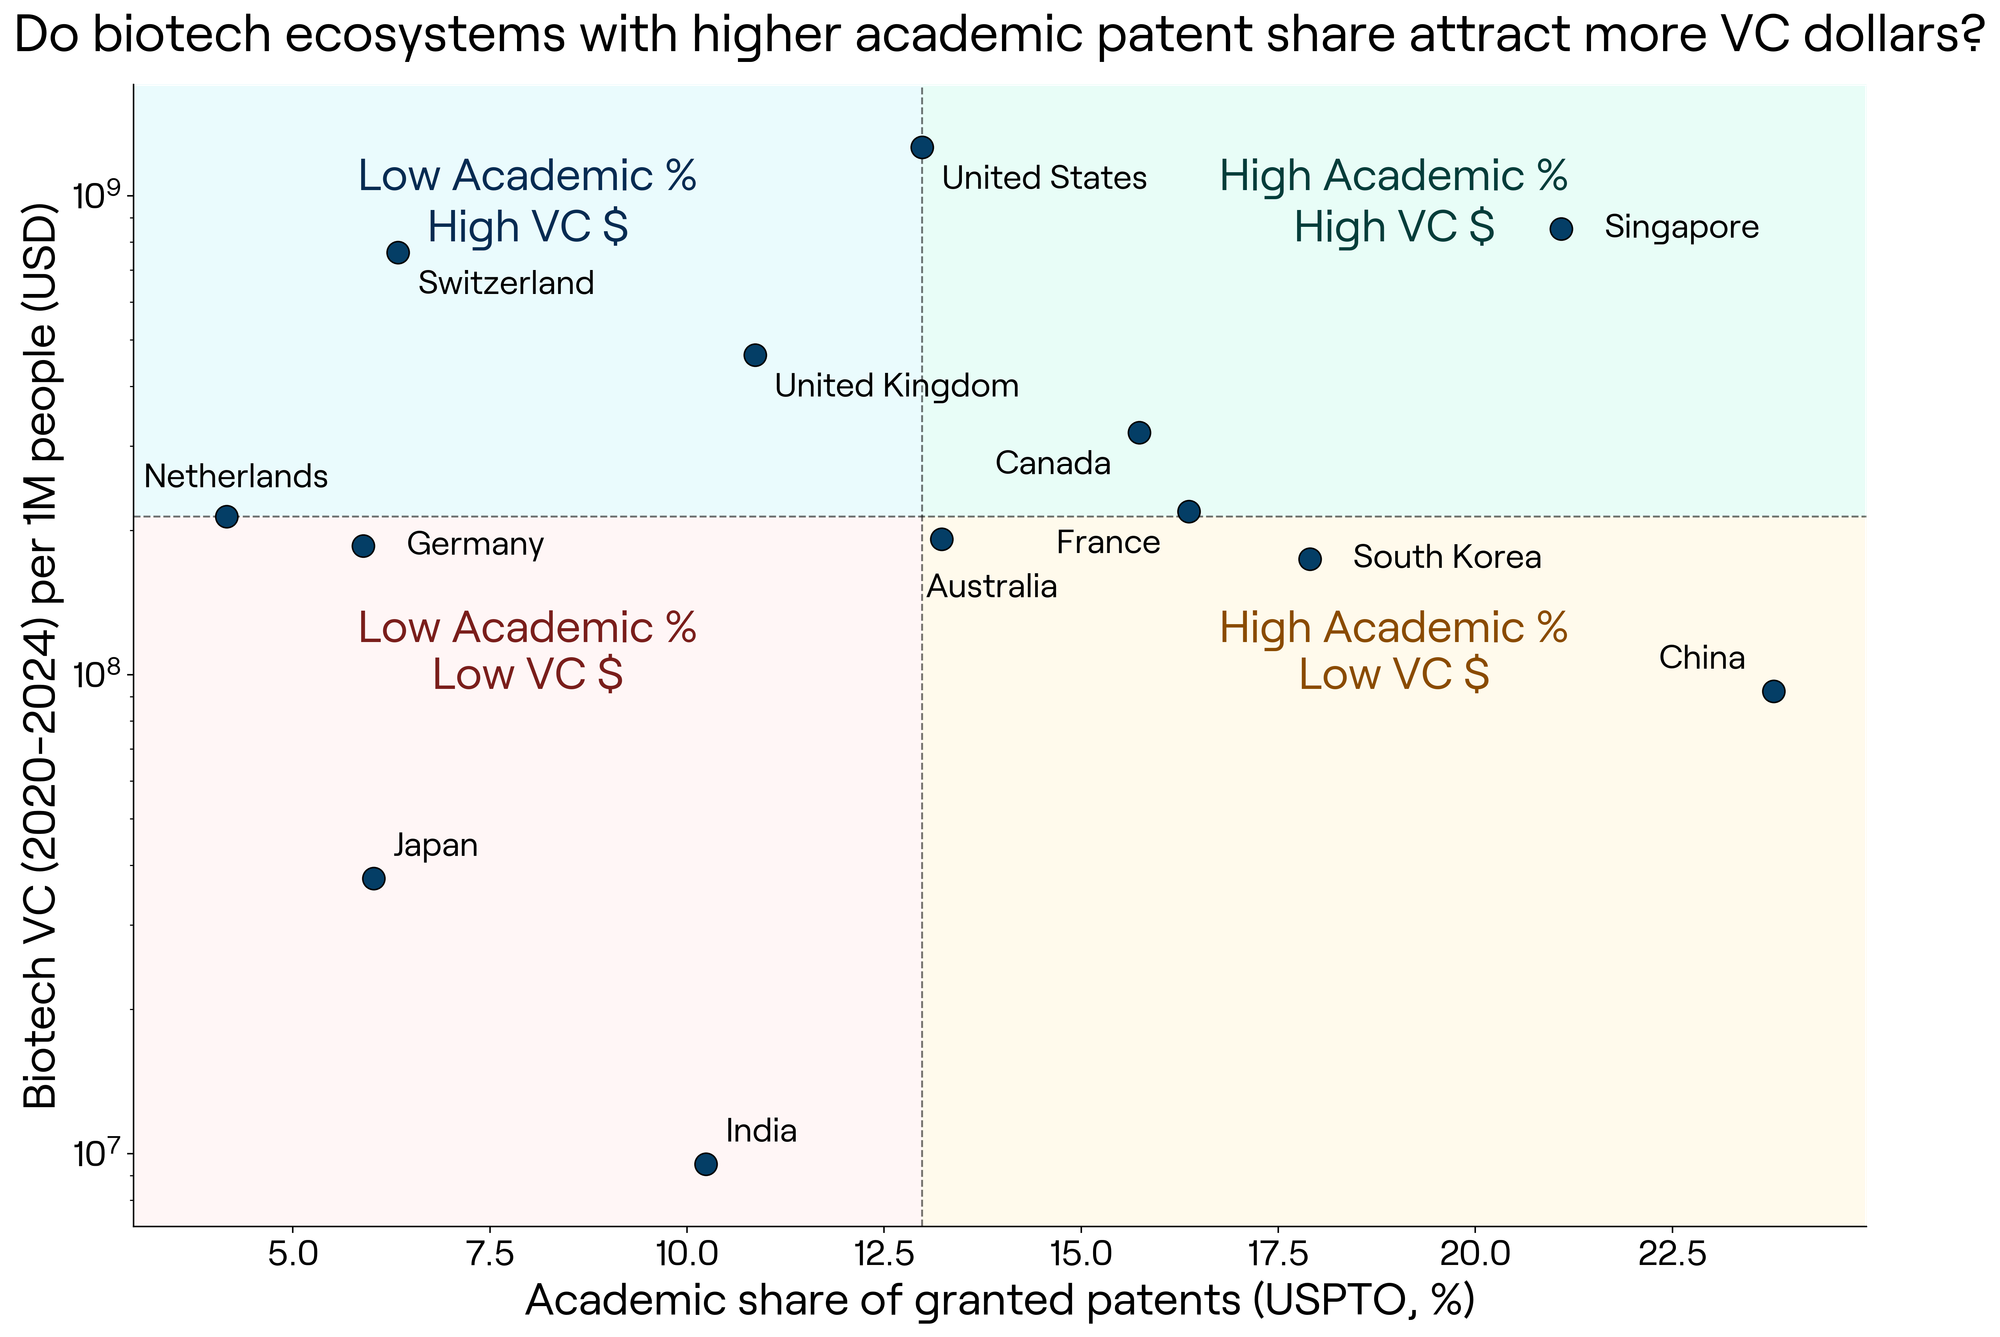
The origin of those patents, however, appears to be nearly irrelevant to investors. Across countries, the relationship between venture capital per capita and academic patent share is weak in both systems (USPTO: r = 0.09, p = 0.76; EPO: r = 0.28, p = 0.36; Figure 7). High-VC countries appear across the full range of academic participation. Singapore combines strong venture investment with a relatively large academic share, while other well-funded ecosystems maintain low academic participation. Countries with high academic patent shares do not reliably attract more funding.
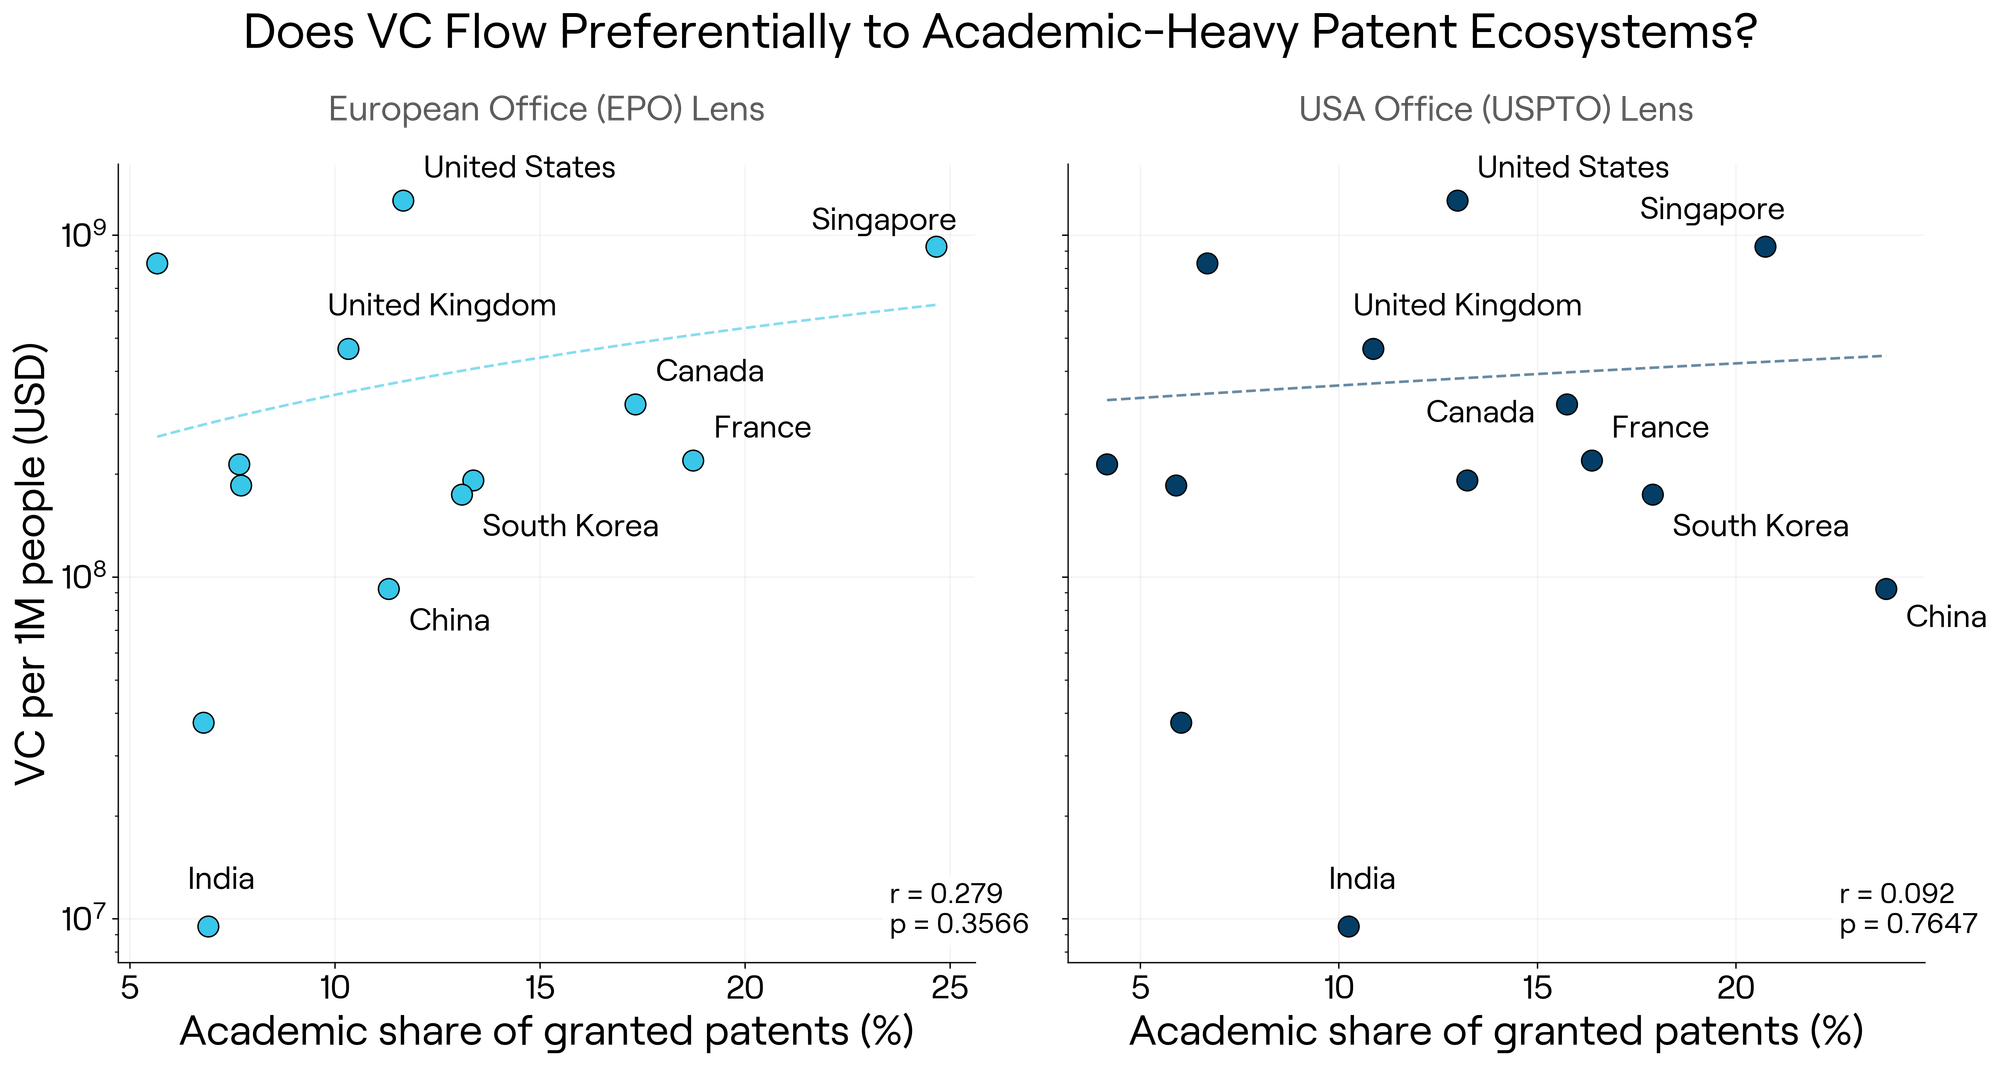
Taken together, these results suggest that venture capital responds to the overall volume and visibility of protected innovation rather than to who owns it. Market size, corporate innovation activity, and commercialization infrastructure likely matter more for attracting sustained investment than the academic share of intellectual property does.
Ecosystems Differ Sharply in How Much IP Each Dollar Buys
Patent volume and venture capital dollars correlate at a high level, but that relationship conceals large differences in how efficiently ecosystems convert funding into granted patents. Figure 8 shifts focus from raw totals to translation, comparing patents granted per $1 million in venture funding.
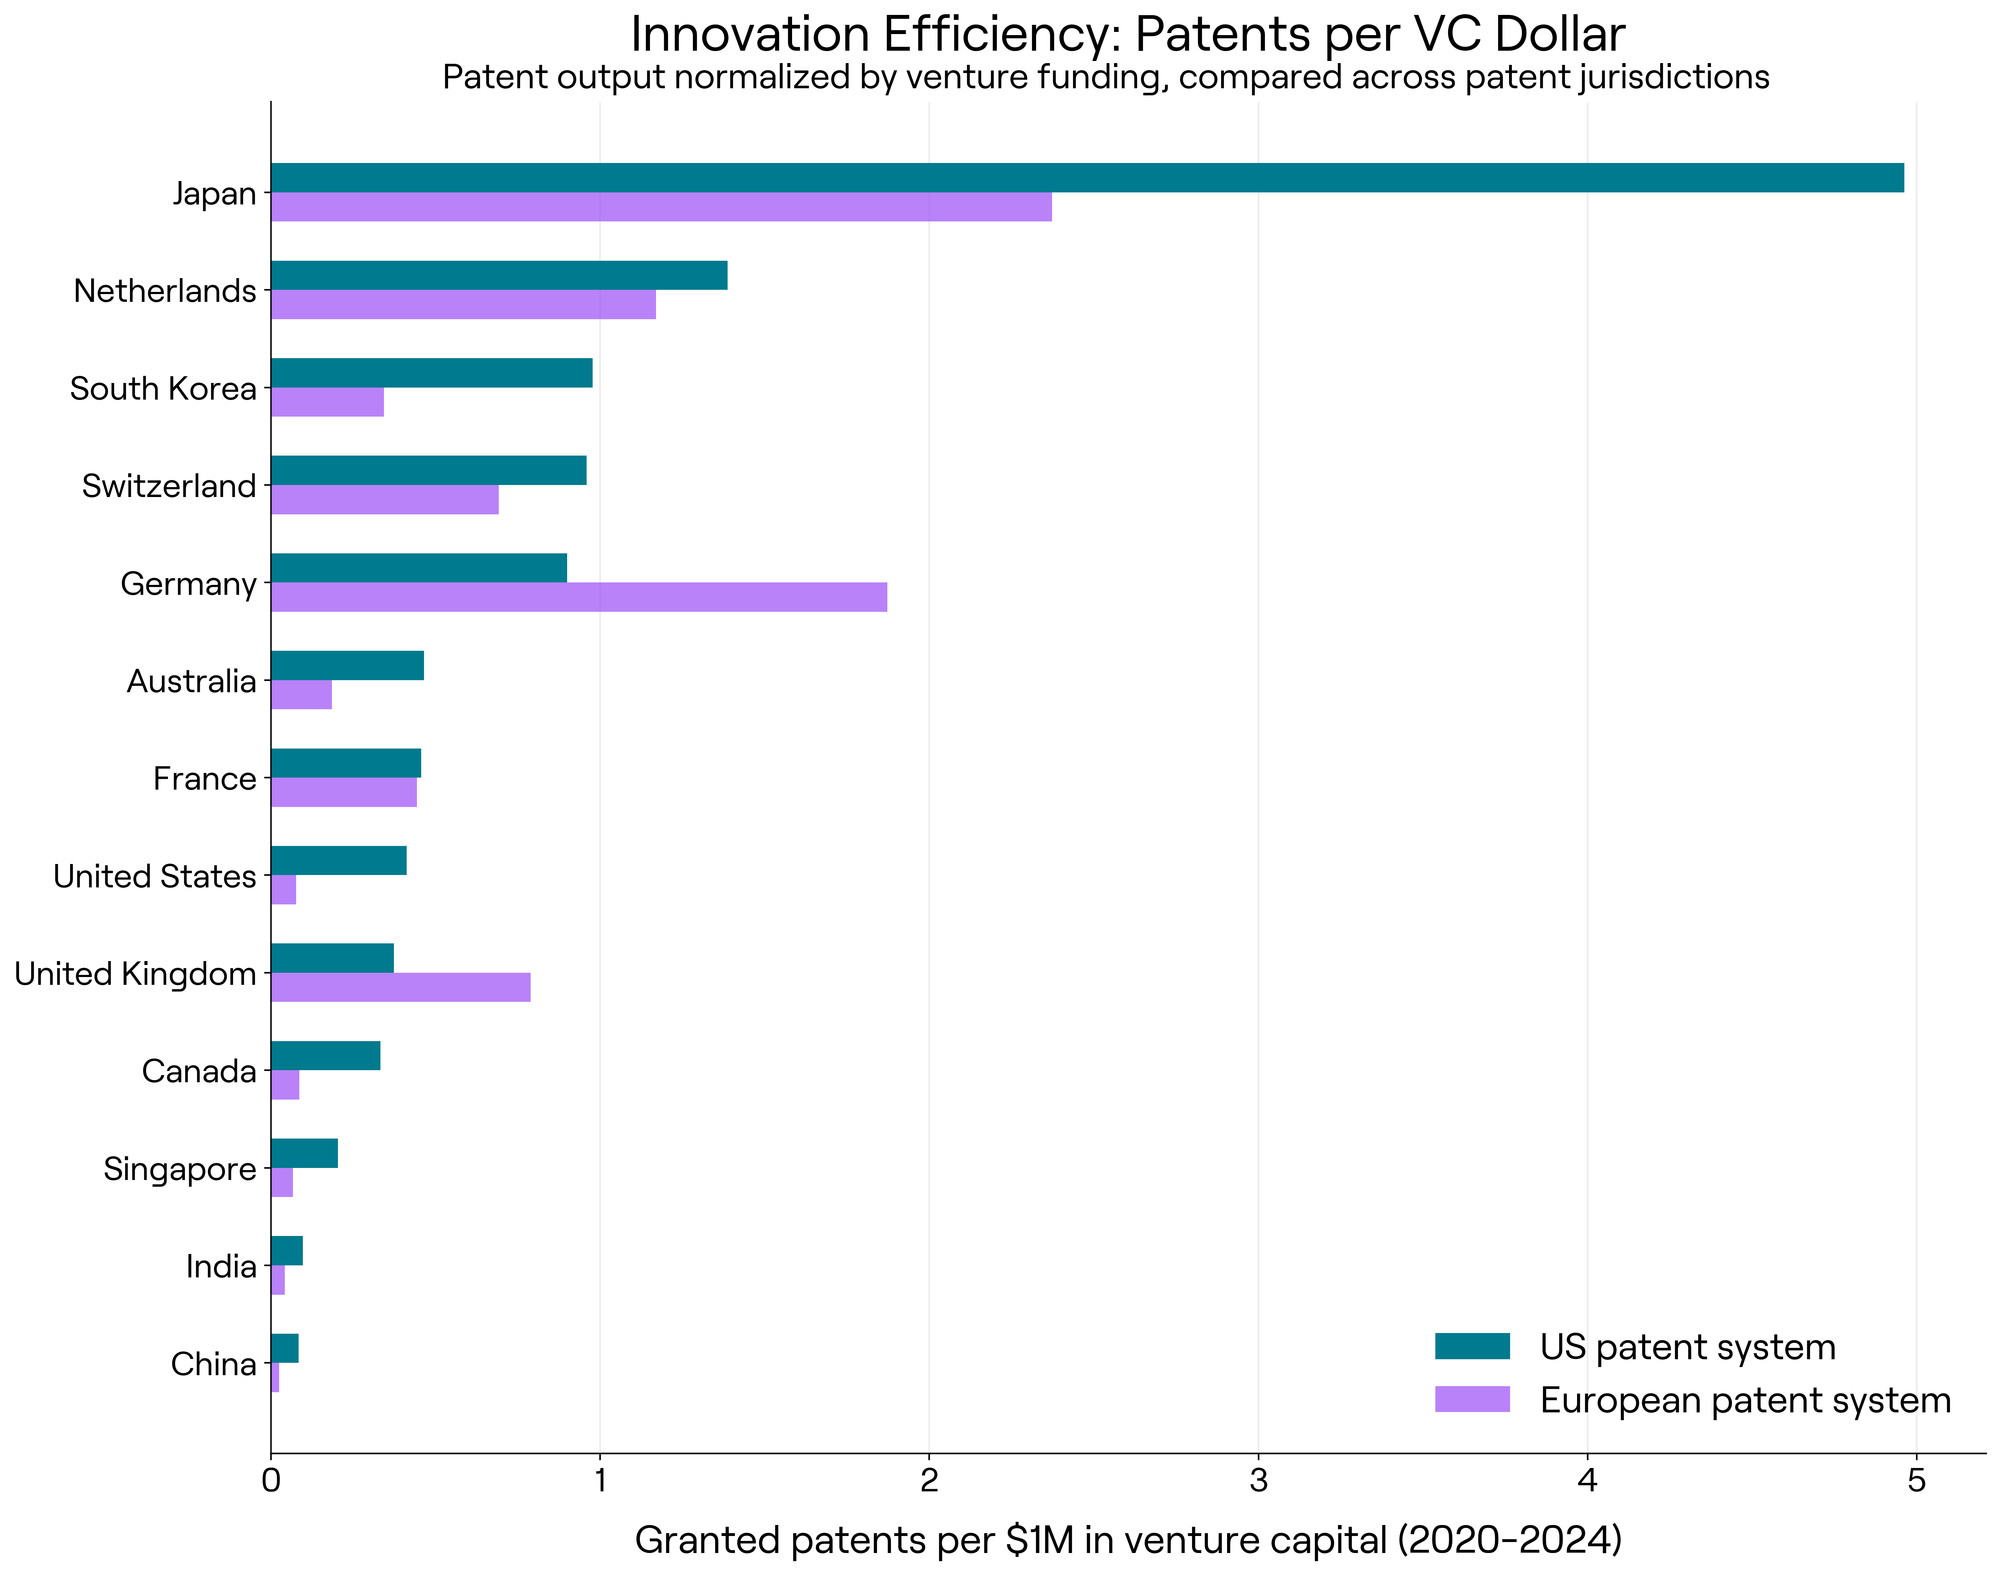
The variation in patent efficiency is wide. Japan, South Korea, and Switzerland produce far more patents per venture dollar than capital-heavy hubs like the United States or Singapore. Relative rankings also shift depending on whether output is measured through the USPTO or the EPO, another reminder that the choice of jurisdiction shapes how innovation appears.
Two caveats matter here. First, patents granted between 2020 and 2024 mostly stem from applications filed years earlier, so this ratio compares outputs against capital that arrived partly after the underlying work was done. It describes a standing relationship between an ecosystem's patent productivity and its funding intensity, not a conversion rate. Second, higher efficiency is not the same as greater downstream success. A high ratio may reflect a tighter funding environment or a cultural emphasis on filing; a low one may reflect capital flowing toward clinical development rather than new filings. This measure describes different strategies, not better and worse ones.
Assessing an Innovation Ecosystem
The same underlying biotech activity can look very different depending on where patents are filed, how universities participate, and which system investors are watching. Three patterns stand out from this analysis:
- Corporate assignees dominate biotech patenting in both the U.S. and European systems, but the academic share varies widely by country, reflecting substantial differences in how universities participate in commercialization.
- Venture capital aligns with patent activity when innovation is measured through the U.S. patent system, and that alignment weakens considerably under the European lens.
- Ecosystems differ substantially in patent output relative to the capital they receive, revealing very different relationships between funding and formal IP.
The quadrant analysis in Figure 9 pulls these together. Countries with similar academic patent shares occupy very different positions on venture capital intensity, and high funding appears in both academic-heavy and corporate-heavy systems, so neither patent volume nor academic participation alone explains where capital goes. One asymmetry is worth noting: while a high academic share does not guarantee strong funding, the most academic-heavy ecosystems in our sample also don't sit at the very bottom of the funding range. Academic strength may not attract capital on its own, but it doesn't appear to repel it either.
For anyone navigating this landscape, some practical implications follow.
If you are an academic inventor, the jurisdiction you file in first is a strategic decision, not an administrative one, and the grace period difference between the USPTO and EPO means a conference talk can quietly close a door in Europe.
If you are evaluating an ecosystem, a high university patent share is not evidence of a well-capitalized one; the two are close to unrelated in our data.
And if you are comparing ecosystems on efficiency, remember that a low patents-per-dollar figure can mean capital is doing something other than generating filings.
Rather than treating biotech hubs as places where ideas or patents are simply produced, it is more useful to see them as translation systems: they determine how research findings become patents, how patents become signals to investors, and how capital converts into durable innovation. An ecosystem's strength is shaped as much by its institutions as by its inventions. For founders, investors, and academic inventors alike, understanding this distinction is not just academic. It shapes where research gets protected, where capital chooses to follow, and ultimately, where the next generation of biotech breakthroughs will call home.
A strong biotech ecosystem is not simply one that produces patents. It is one that knows what to do with them.
Hidden Layers Team
| Lead | Lauren Stanwicks |
| Team Members | Romina Horianski, Anisha Sharma, Pranita Atri, Lauren Clubb, Roberto Ogelman, Shivaranjani Balamurugan |
Methodology
This article combines patent data, venture capital flows, and institutional classification to examine how biotech ecosystems translate research into protected intellectual property.
Using the AcademicLabs database, we analyzed biotech patents granted by the USPTO and the EPO between 2020 and 2024. Biotech patents were identified using [IPC / CPC] subclasses spanning biotechnology, pharmaceuticals, biomedical devices, and analytical methods. The same set was applied to both the USPTO and EPO datasets, so the two systems are compared on identical technological scope. Patents classified in more than one listed subclass are counted once. To determine origin, we classified each assignee as either an academic institution (universities and public research organizations) or a corporate entity. Venture capital data was extracted from Crunchbase's Advanced Search tool, capturing total biotech investment at the country level over the same period. All funding metrics are normalized per capita. The 13 countries included were selected based on availability of both patent and venture capital data.
We evaluate ecosystems on three measures:
- Innovation output: total granted biotech patents per capita, calculated separately for the USPTO and EPO datasets.
- Institutional origin: academic share of granted patents, as a proxy for the role of universities in generating protected innovation.
- Capital efficiency: patents granted per $1 million in venture funding.
We quantified relationships between these measures using Pearson correlation. We then positioned countries in a quadrant framework based on academic patent share and venture capital intensity, which allowed us to identify distinct ecosystem profiles and to assess whether academic participation aligns with capital allocation.
Limitations
Several constraints shape how these results should be read.
Our sample is small. Thirteen countries, split into five European and eight non-European, means individual correlations are sensitive to single data points, and subgroup comparisons in particular should be treated as exploratory.
This analysis captures only innovation that has been formally registered through patenting, and therefore under-represents early-stage, unpatented, or trade-secret research. Venture capital data is aggregated at the country level and does not distinguish investment stage, which affects efficiency comparisons: an ecosystem weighted toward late-stage clinical financing will look inefficient on a patents-per-dollar basis even when its research base is strong. Finally, grant timing lags filing by several years, so patents and capital measured over the same window are not causally linked.
References
- Taalbi, J. (2025). Innovation with and without patents-an information-theoretic approach. Scientometrics, 130(9), 4879-4897. https://doi.org/10.1007/s11192-025-05406-y
- Brookings Institution, Eleven facts about innovation and patents. https://www.brookings.edu/articles/eleven-facts-about-innovation-and-patents/
- 35 U.S.C. 102(b)(1) (USPTO grace period); European Patent Convention, Article 55 (EPO non-prejudicial disclosures).